See it work
An infinite canvas in the browser that you edit by hand while agents edit it beside you.
Every picture here is a screenshot of toucan running, made by a script against a real server. Where it says an agent did something, that is a real turn of the chat agent on Codex, unedited. There is no public server to try, because toucan is built for your own machine or a trusted network, but the Explore page lets you click through some of these canvases.
Ask, and it draws
The chat panel sits beside the canvas. Asked for "A sequence diagram of a user resetting their password by email.", the agent drew this and checked its own work.
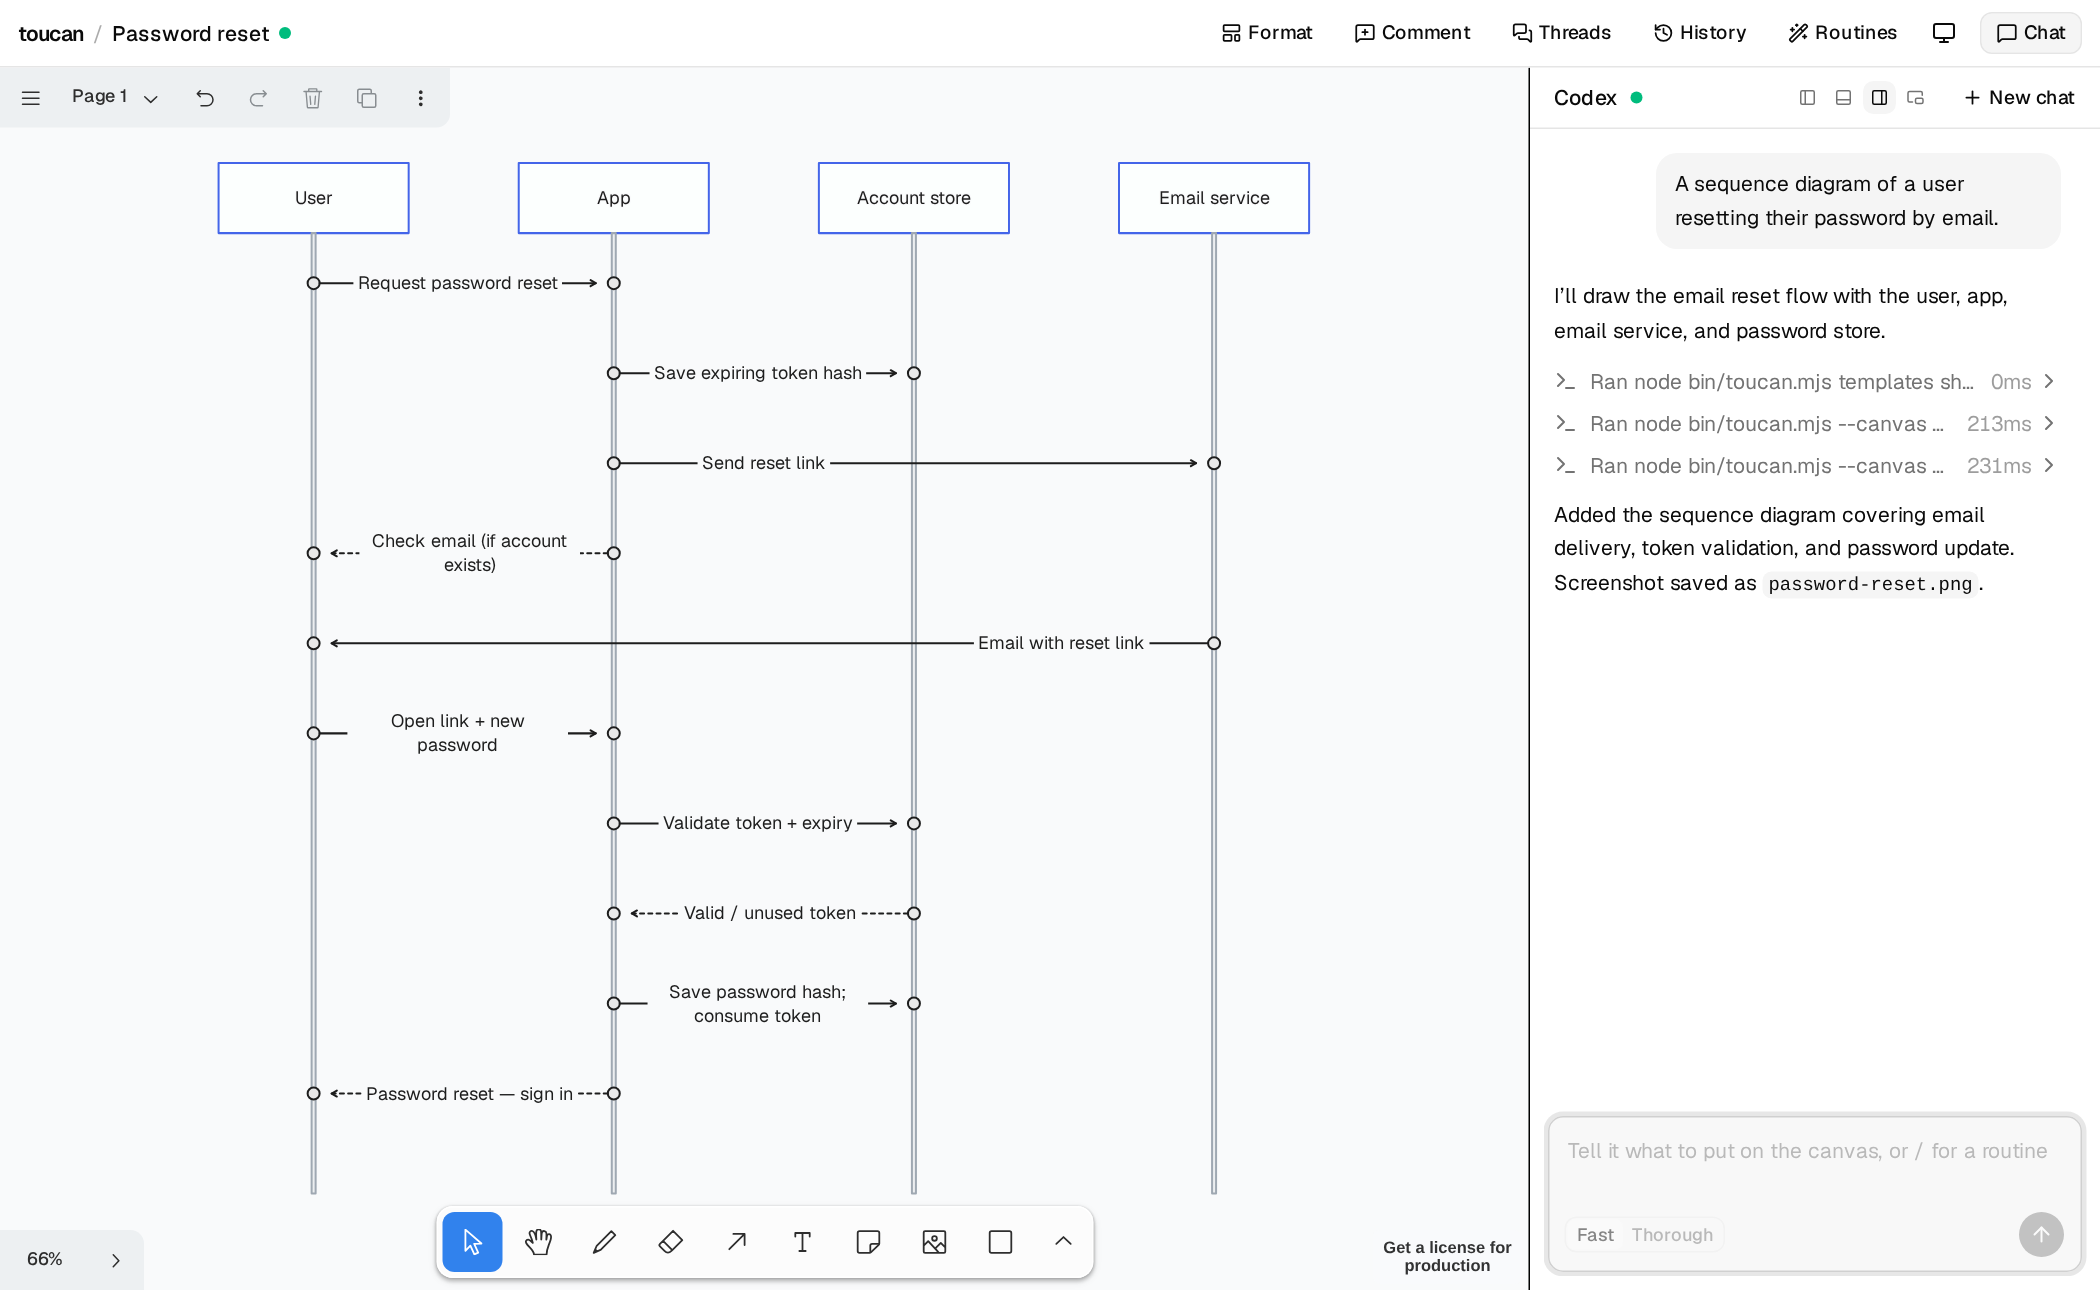
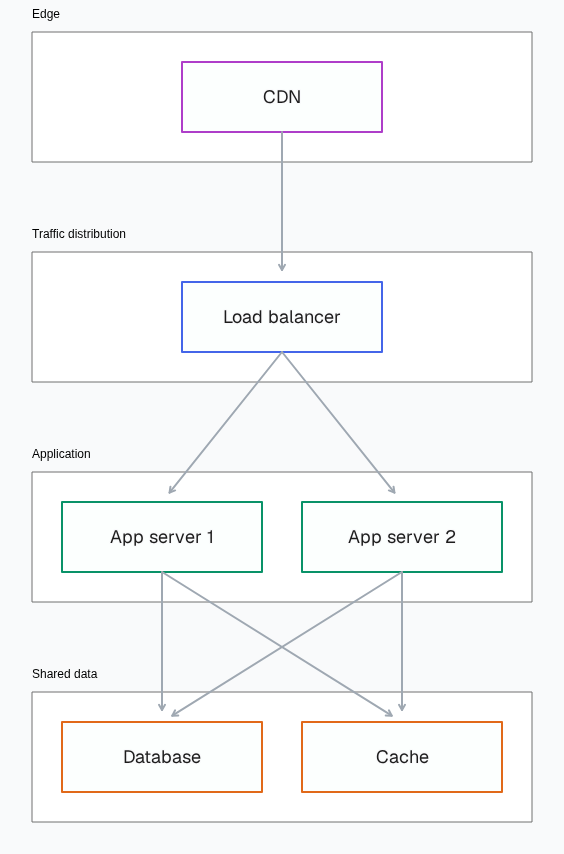
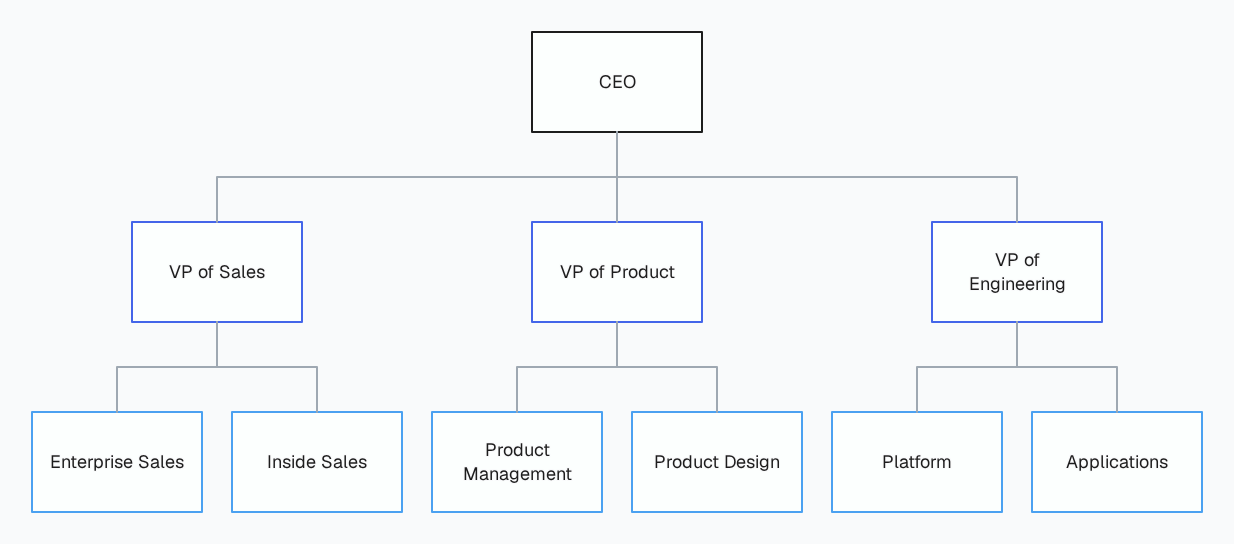
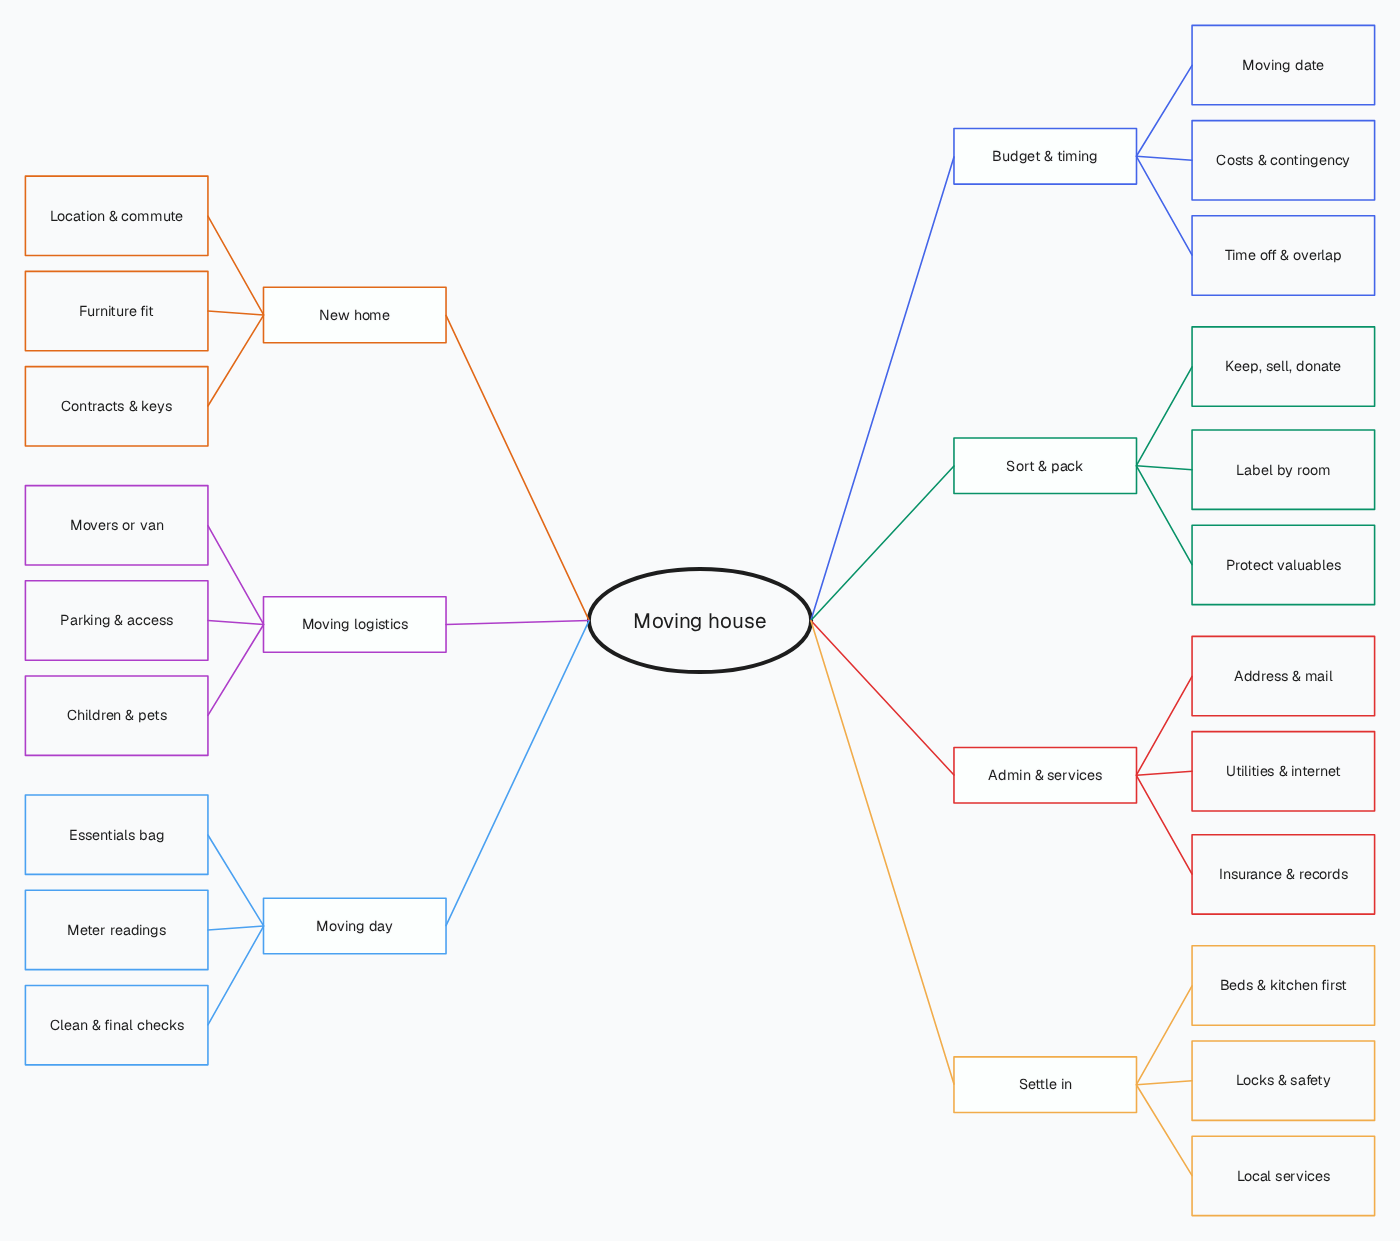
Agents don't place boxes by hand. They describe the diagram and a layout engine places it, which is why this takes seconds. Here are four more requests, from the set toucan is tested against: across 8 requests the average score is 95 of 100, in about 18 seconds each.
"Diagram a web app's architecture with a CDN, load balancer, two app servers, a database and a cache."
"Make an org chart: a CEO, with VPs of sales, product and engineering, each with two teams under them."
"A mind map of things to think about when moving house."
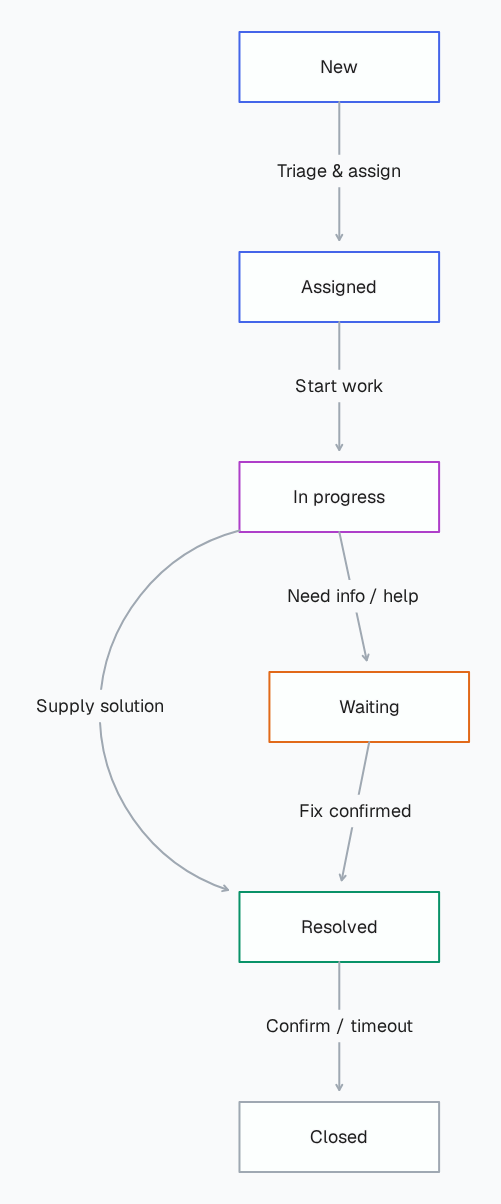
"The states a support ticket moves through, and what moves it between them."
Describe it as data
Any agent, or any script of yours, can do the same from a terminal. A diagram is a small description, in the same form as the templates, and toucan draw places it. This one is shortened; the full version has seven boxes.
{
  "kind": "flow",
  "direction": "RIGHT",
  "nodes": [
    {"id":"cart","text":"Review cart","shape":"oval"},
    {"id":"address","text":"Enter address"},
    {"id":"pay","text":"Take payment"},
    {"id":"ok","text":"Approved?","shape":"diamond"}
  ],
  "edges": [
    {"from":"cart","to":"address"},
    {"from":"address","to":"pay"},
    {"from":"pay","to":"ok"}
  ]
}
toucan --canvas checkout draw checkout.json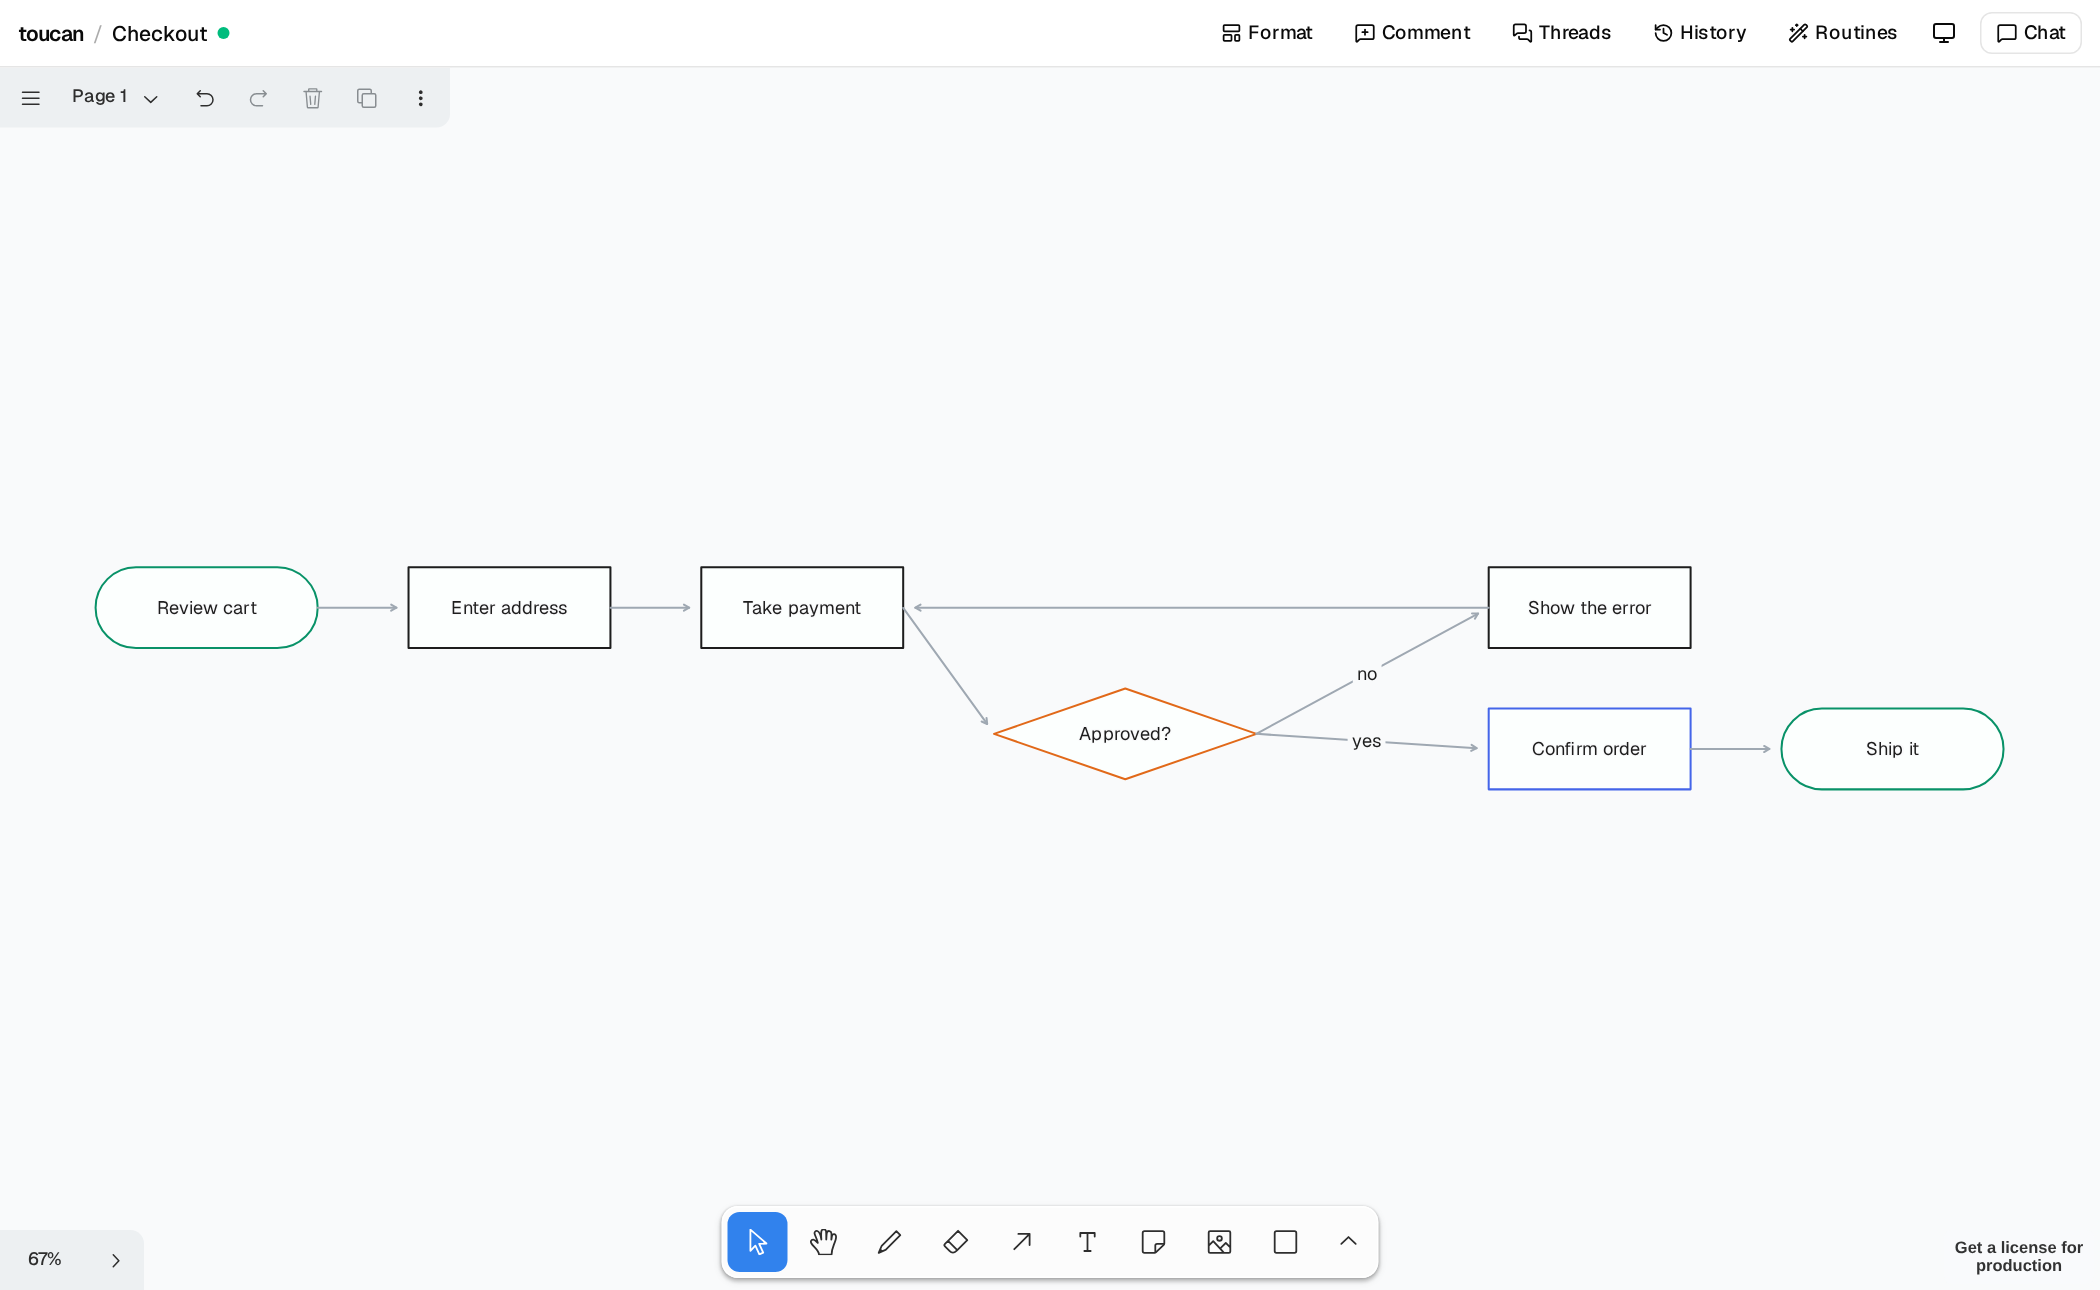
A second drawing lands beside the first and never over it. --update changes an earlier one.
Or as Mermaid
Mermaid works as an edit language too. On a blank canvas it comes out looking like a template, and it merges by key on a full one, so importing it again changes only what differs.
flowchart LR
  idea[Idea] --> draft[Draft]
  draft --> review{Reviewed?}
  review -->|yes| publish[Publish]
  review -->|no| draft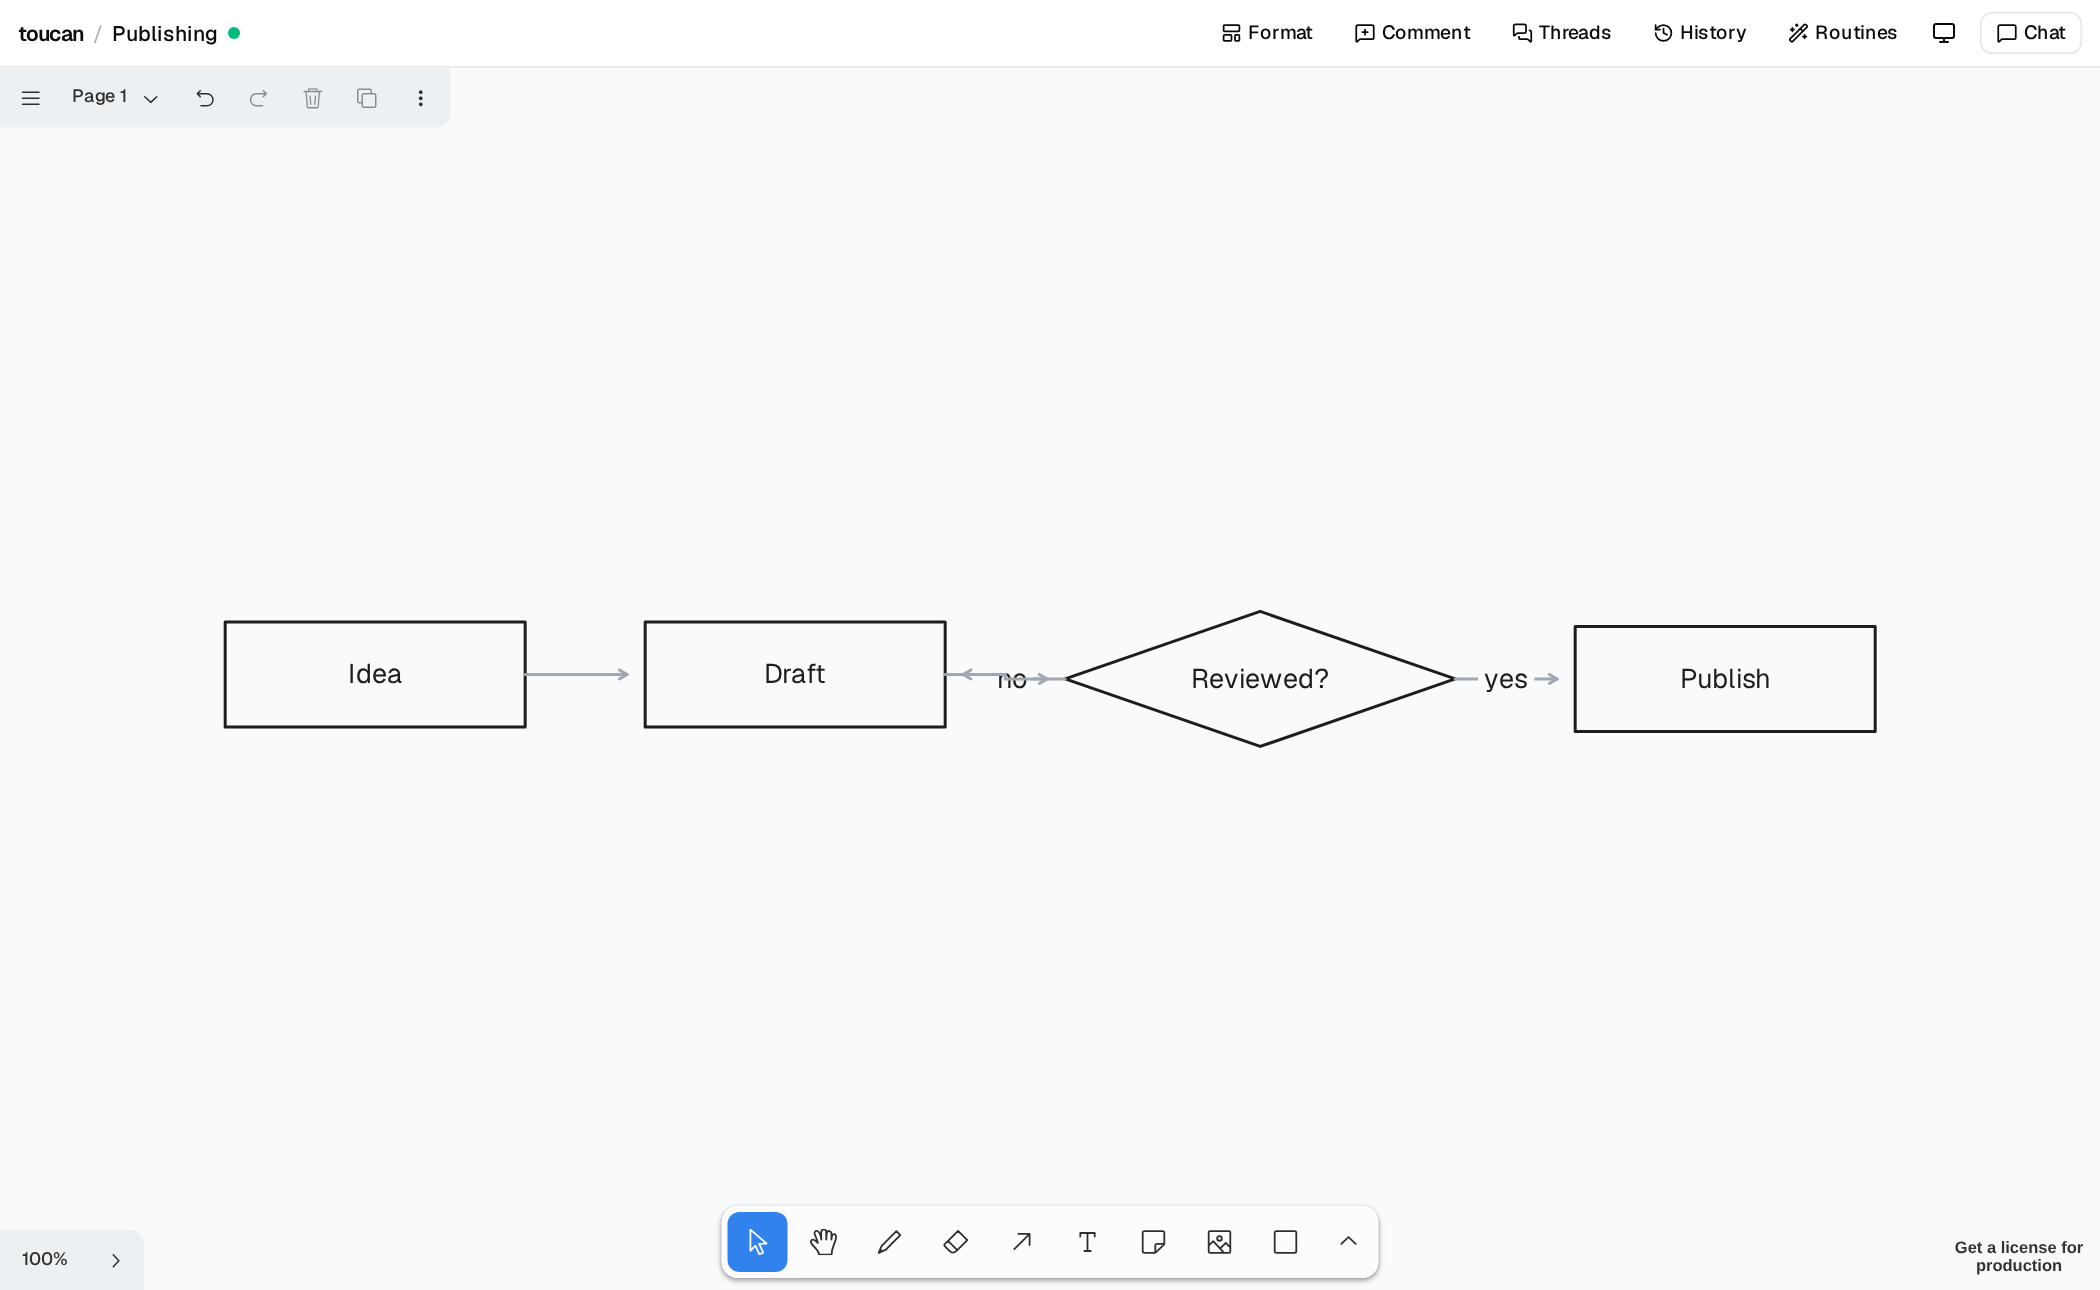
What goes in comes back out. The same canvas as DOT:
digraph toucan {
  rankdir=LR;
  node [shape=box, style="rounded,filled", fillcolor="#ffffff", fontname="Helvetica", fontsize=10];
  "draft" [label="Draft", color="#1d1d1d"];
  "idea" [label="Idea", color="#1d1d1d"];
  "review" [label="Reviewed?", color="#1d1d1d", shape=diamond];
  "publish" [label="Publish", color="#1d1d1d"];
  "review" -> "publish" [label="yes", color="#9fa8b2"];
  "draft" -> "review" [color="#9fa8b2"];
  "review" -> "draft" [label="no", color="#9fa8b2"];
  "idea" -> "draft" [color="#9fa8b2"];
}
It also exports JSON Canvas (for Obsidian), .excalidraw and toucan's own graph format.
Tldraw or Excalidraw
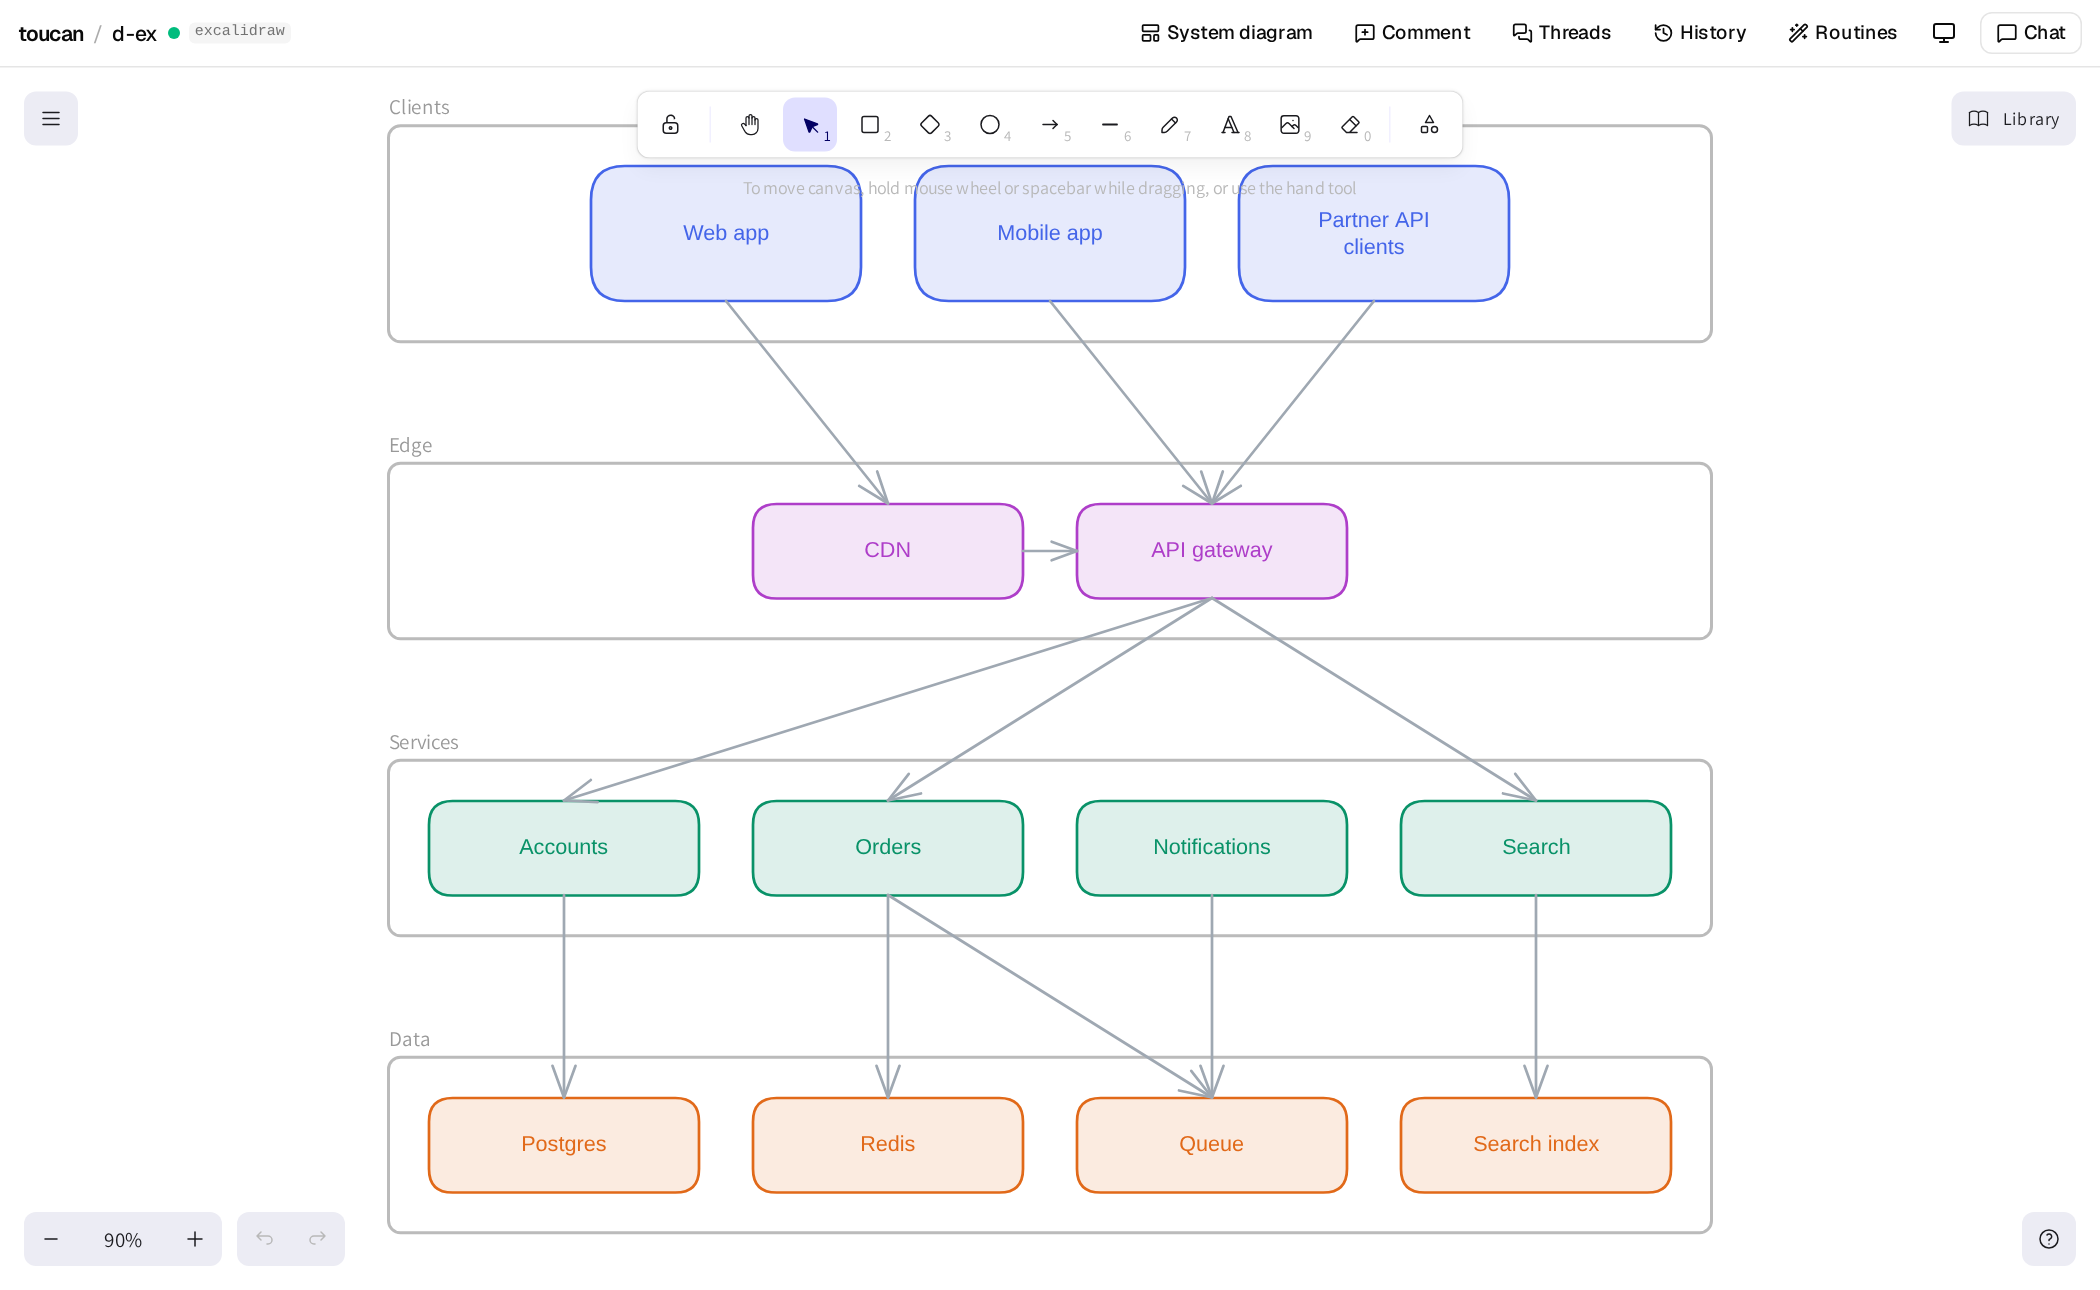
A canvas runs on either engine, and converts between them with its keys, text, frames and arrows intact. Some styling is approximated: Excalidraw draws these arrows straight, for one.
Tidy it up
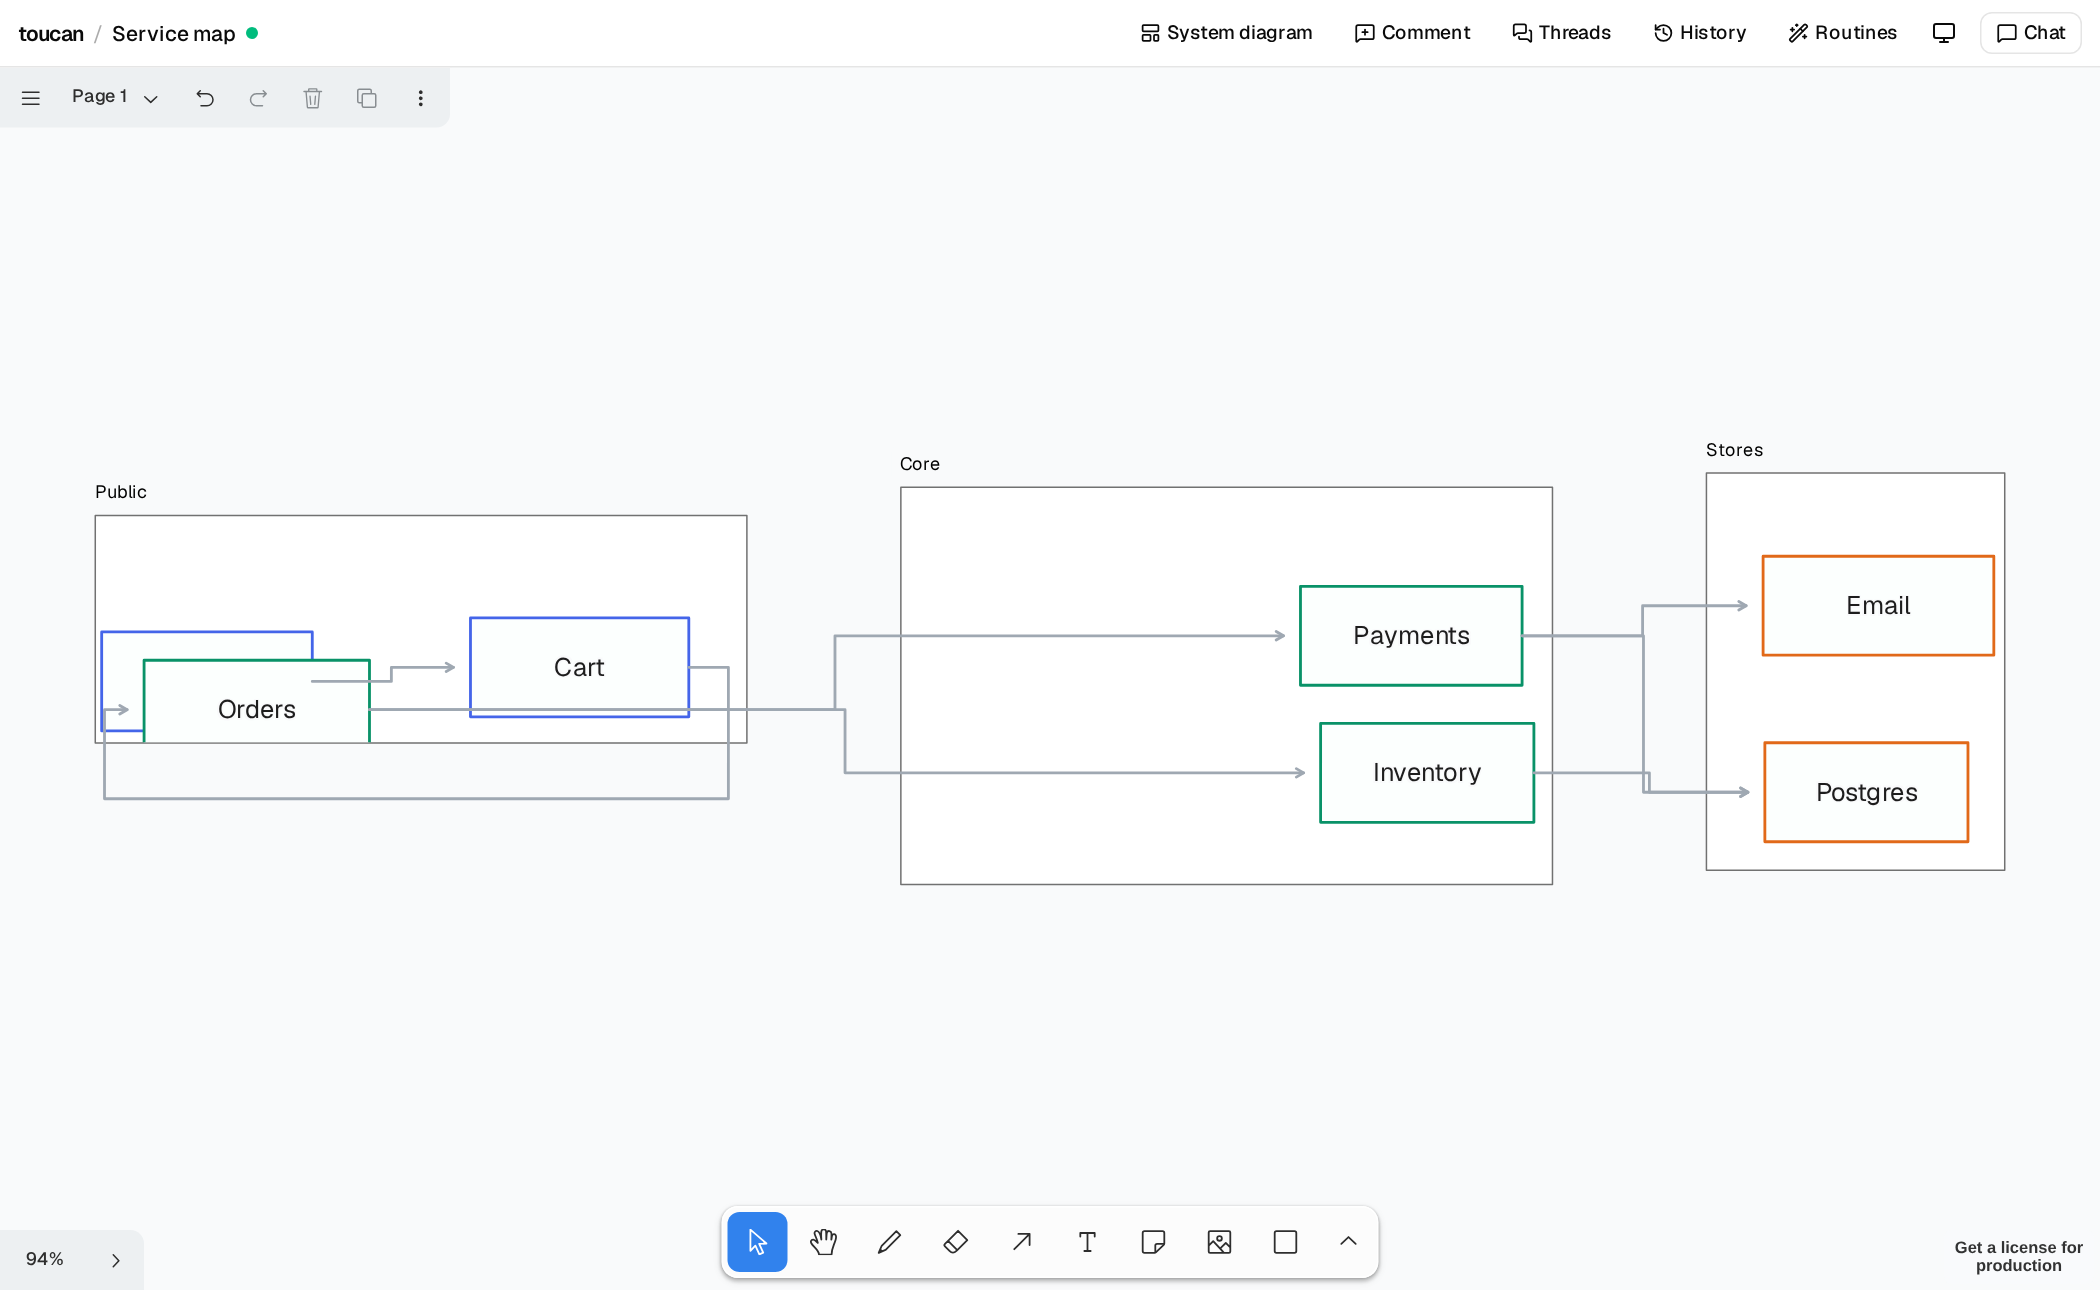
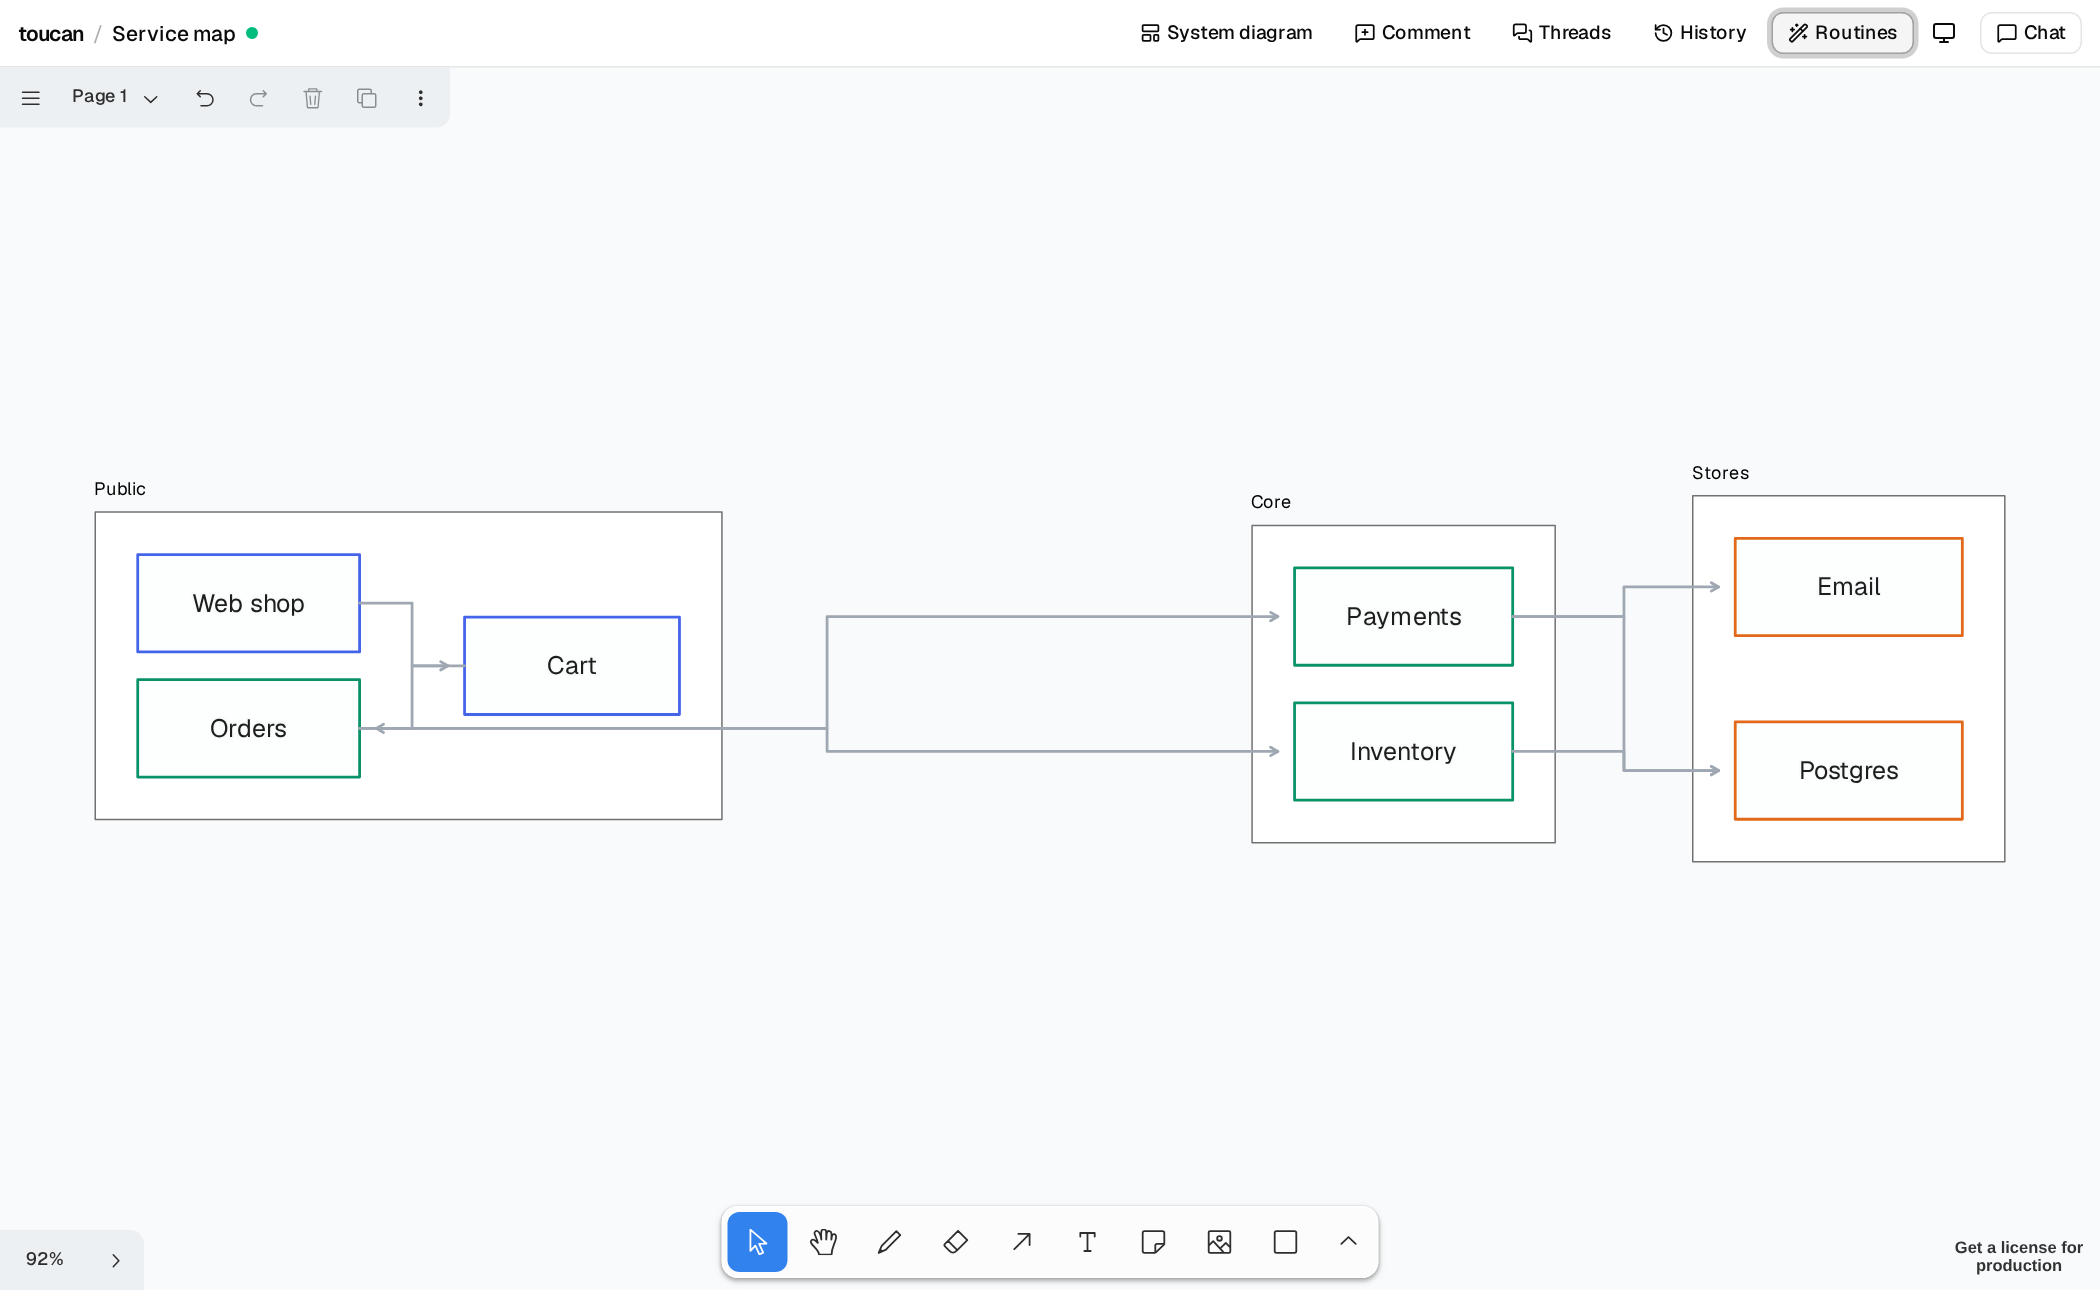
Diagrams get knocked about. Routines are chores banked once and run from a menu or the CLI, each one undoable in a single step, and they keep your arrangement rather than starting over. Here a service map scored 99 when clean and 58 after being knocked about.
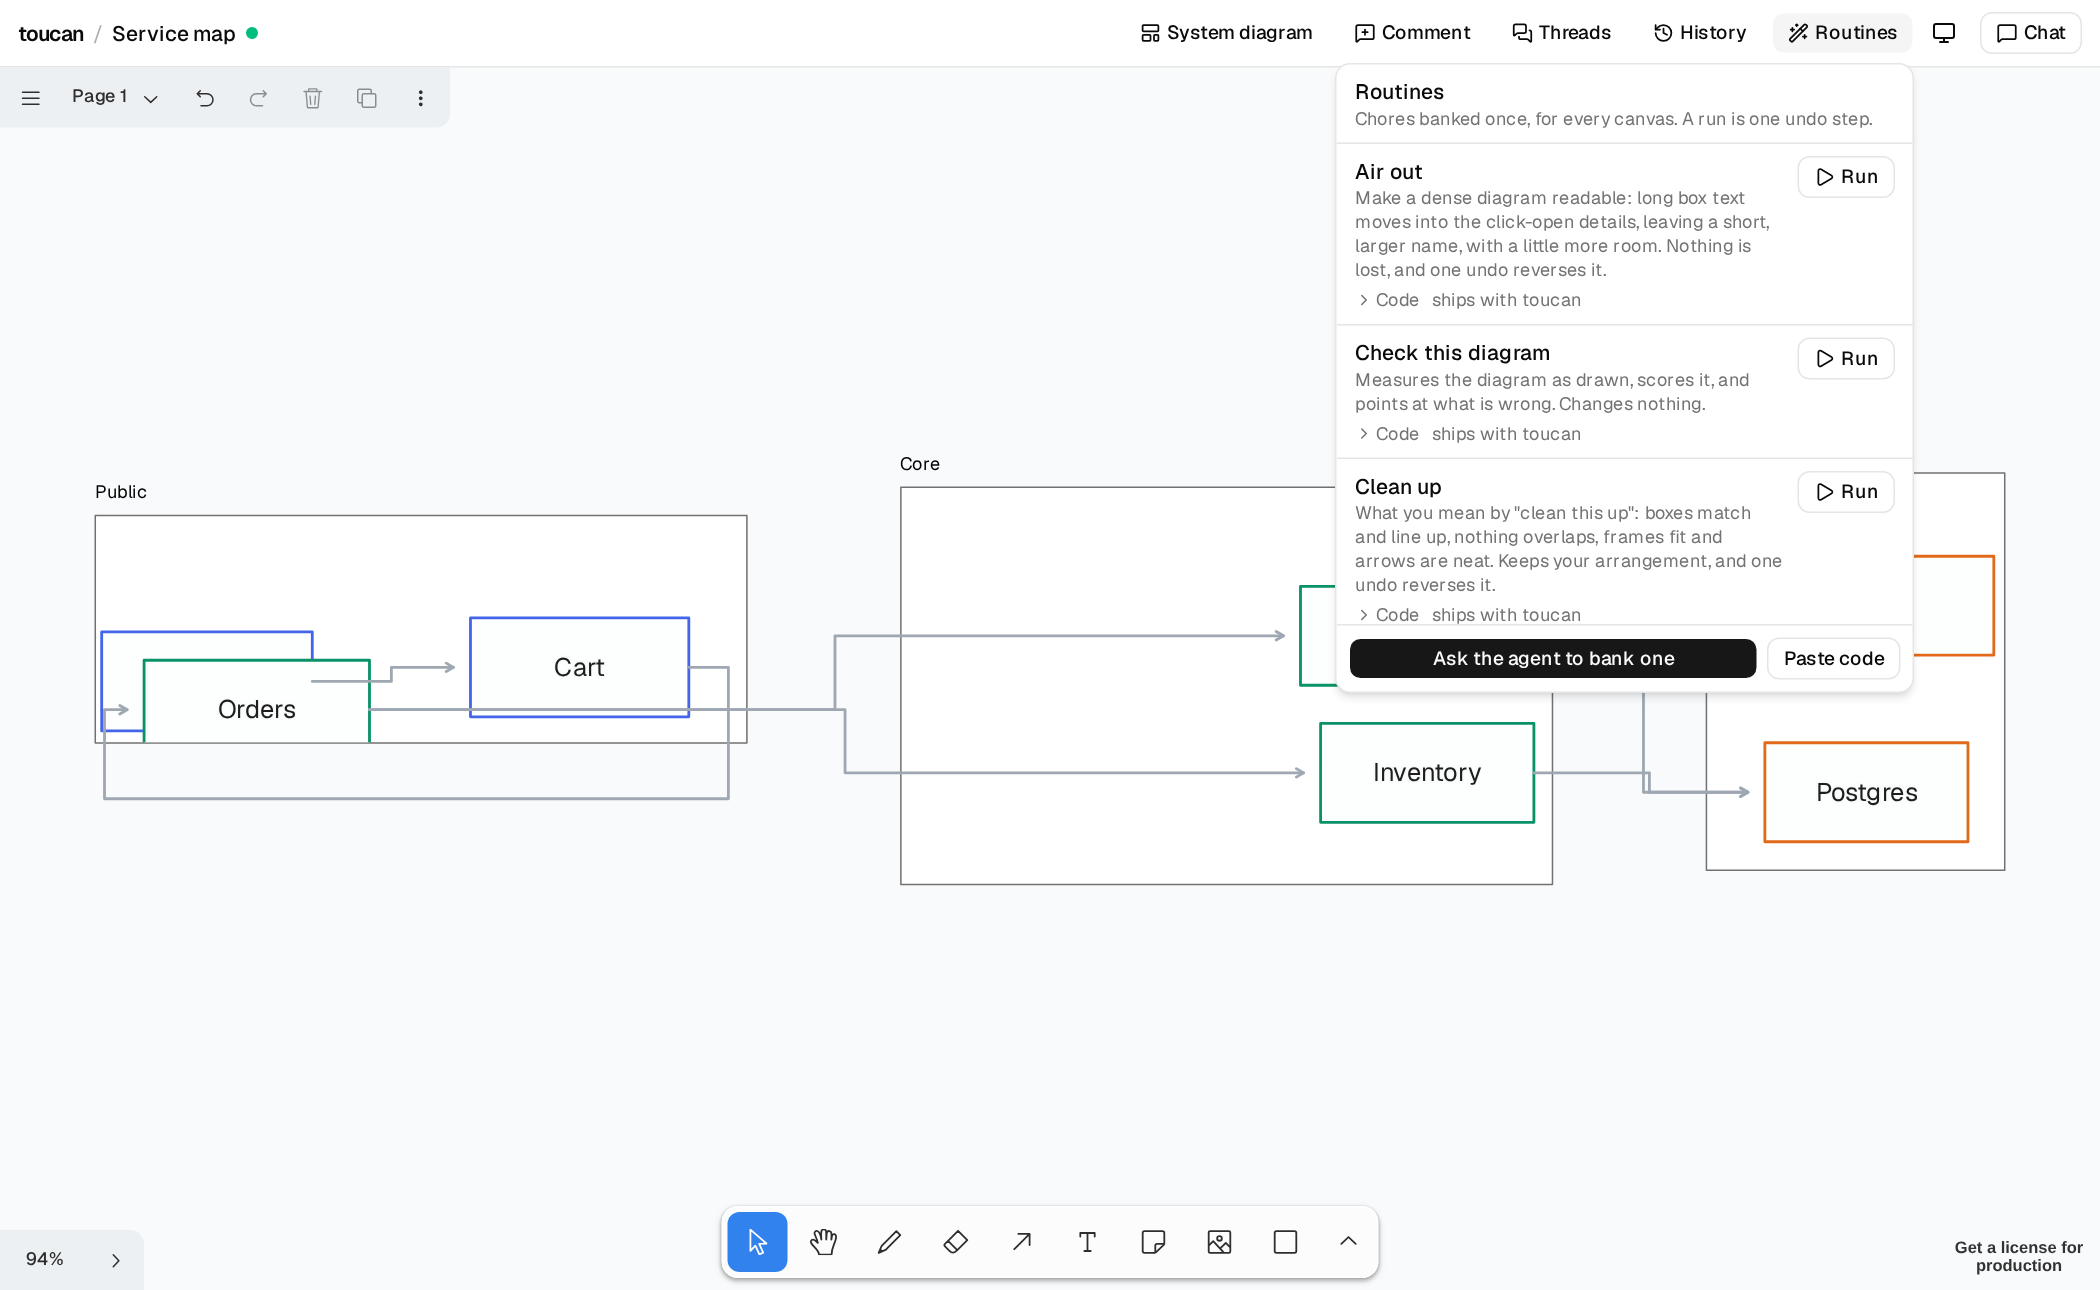
Check this diagram scores what's drawn and names the shapes at fault, so an agent can fix what it finds instead of squinting at a screenshot.
Short boxes, with the rest a click away
A box holds a name. What's behind it opens in a card when you select it, and on a canvas with a format, ← and → walk you through. This is the Odyssey as a story map.
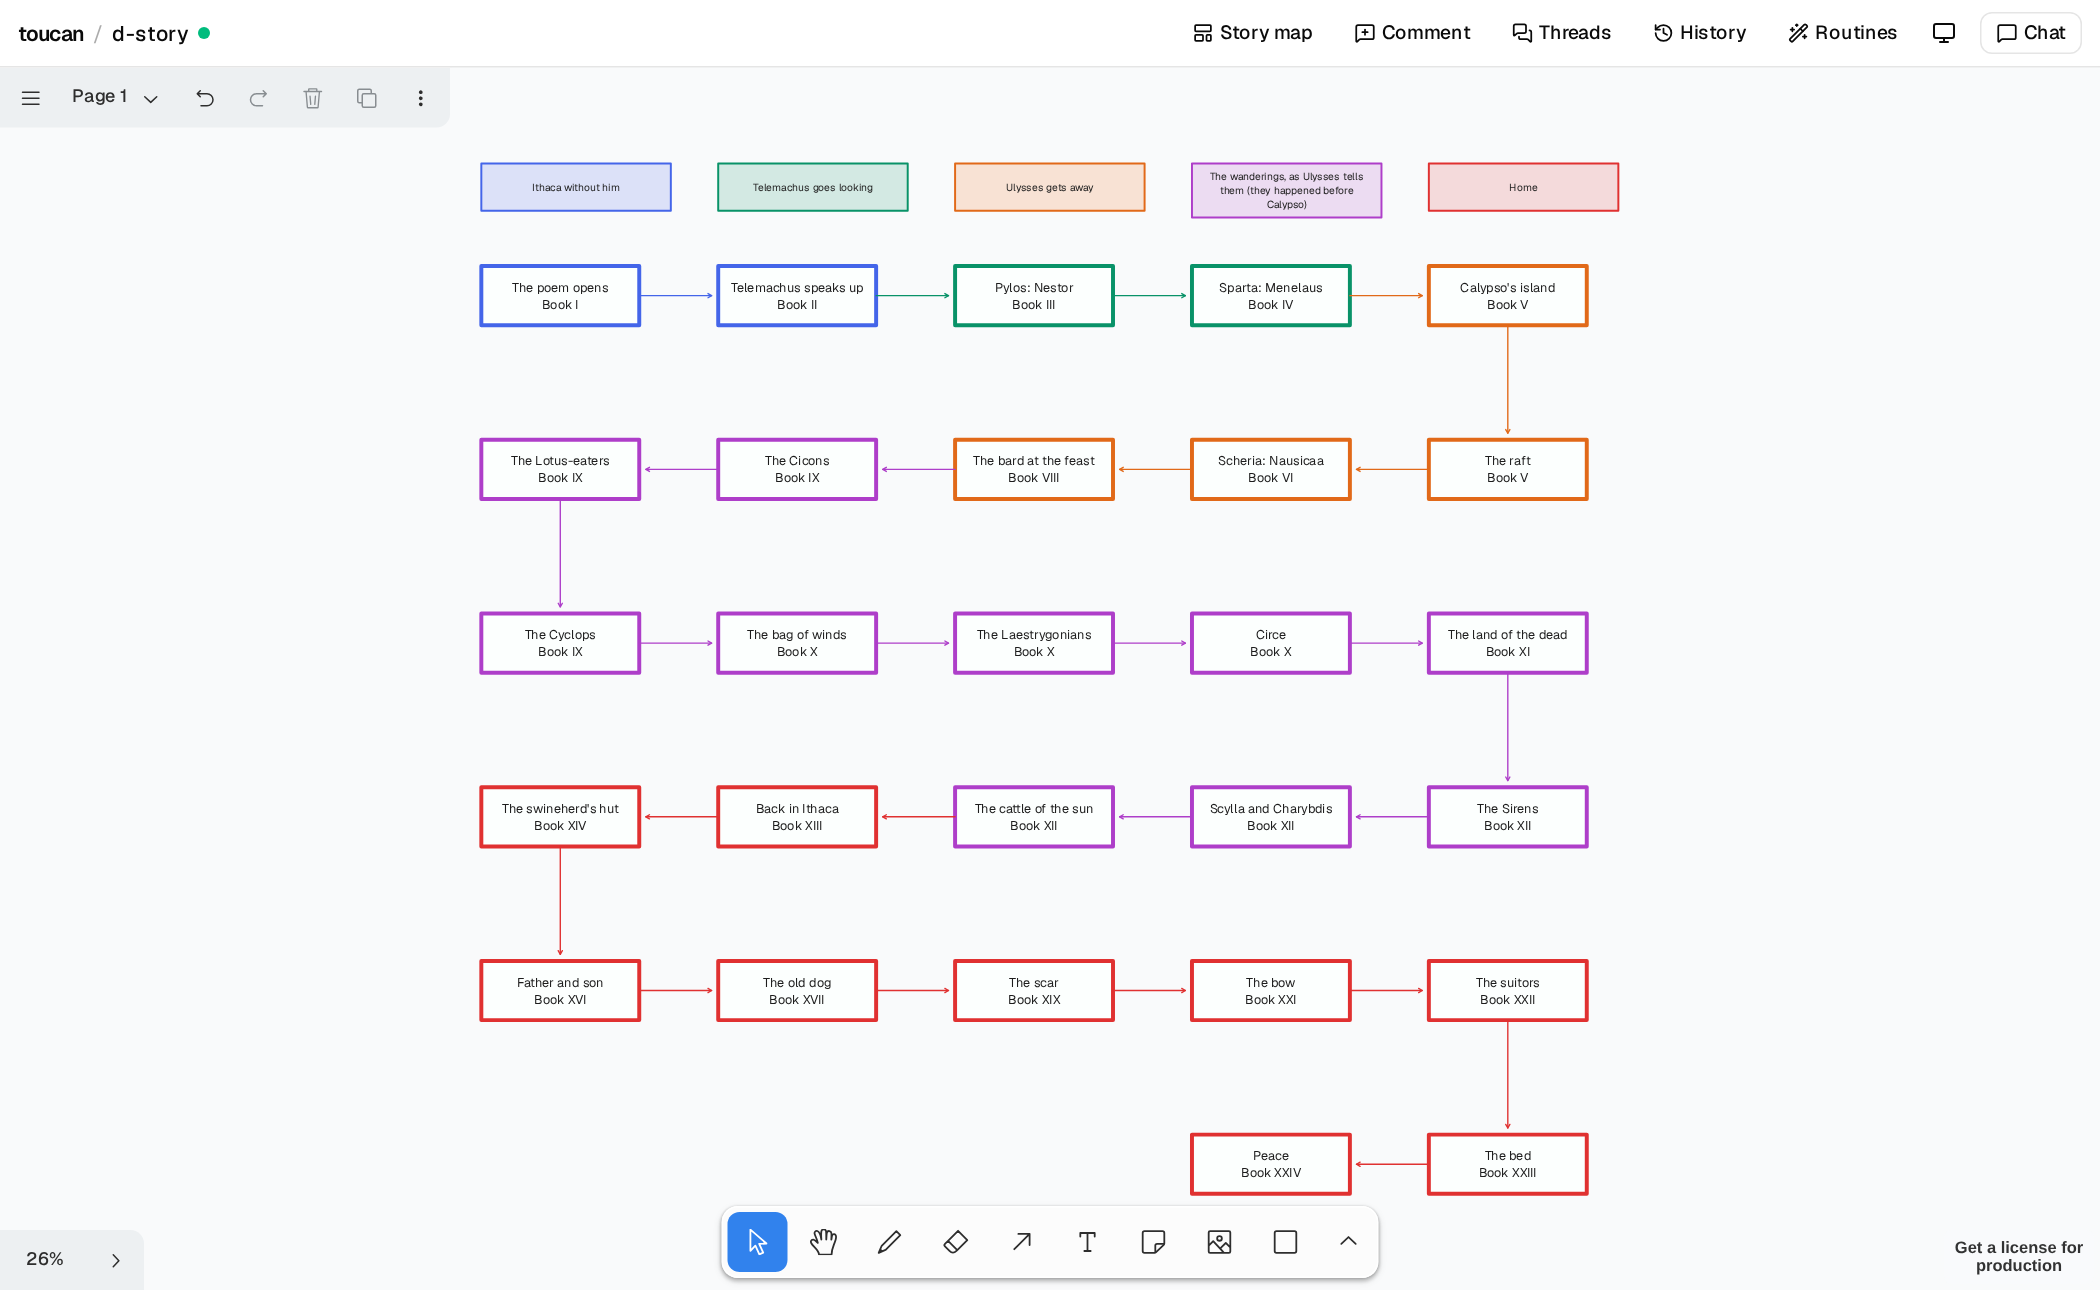
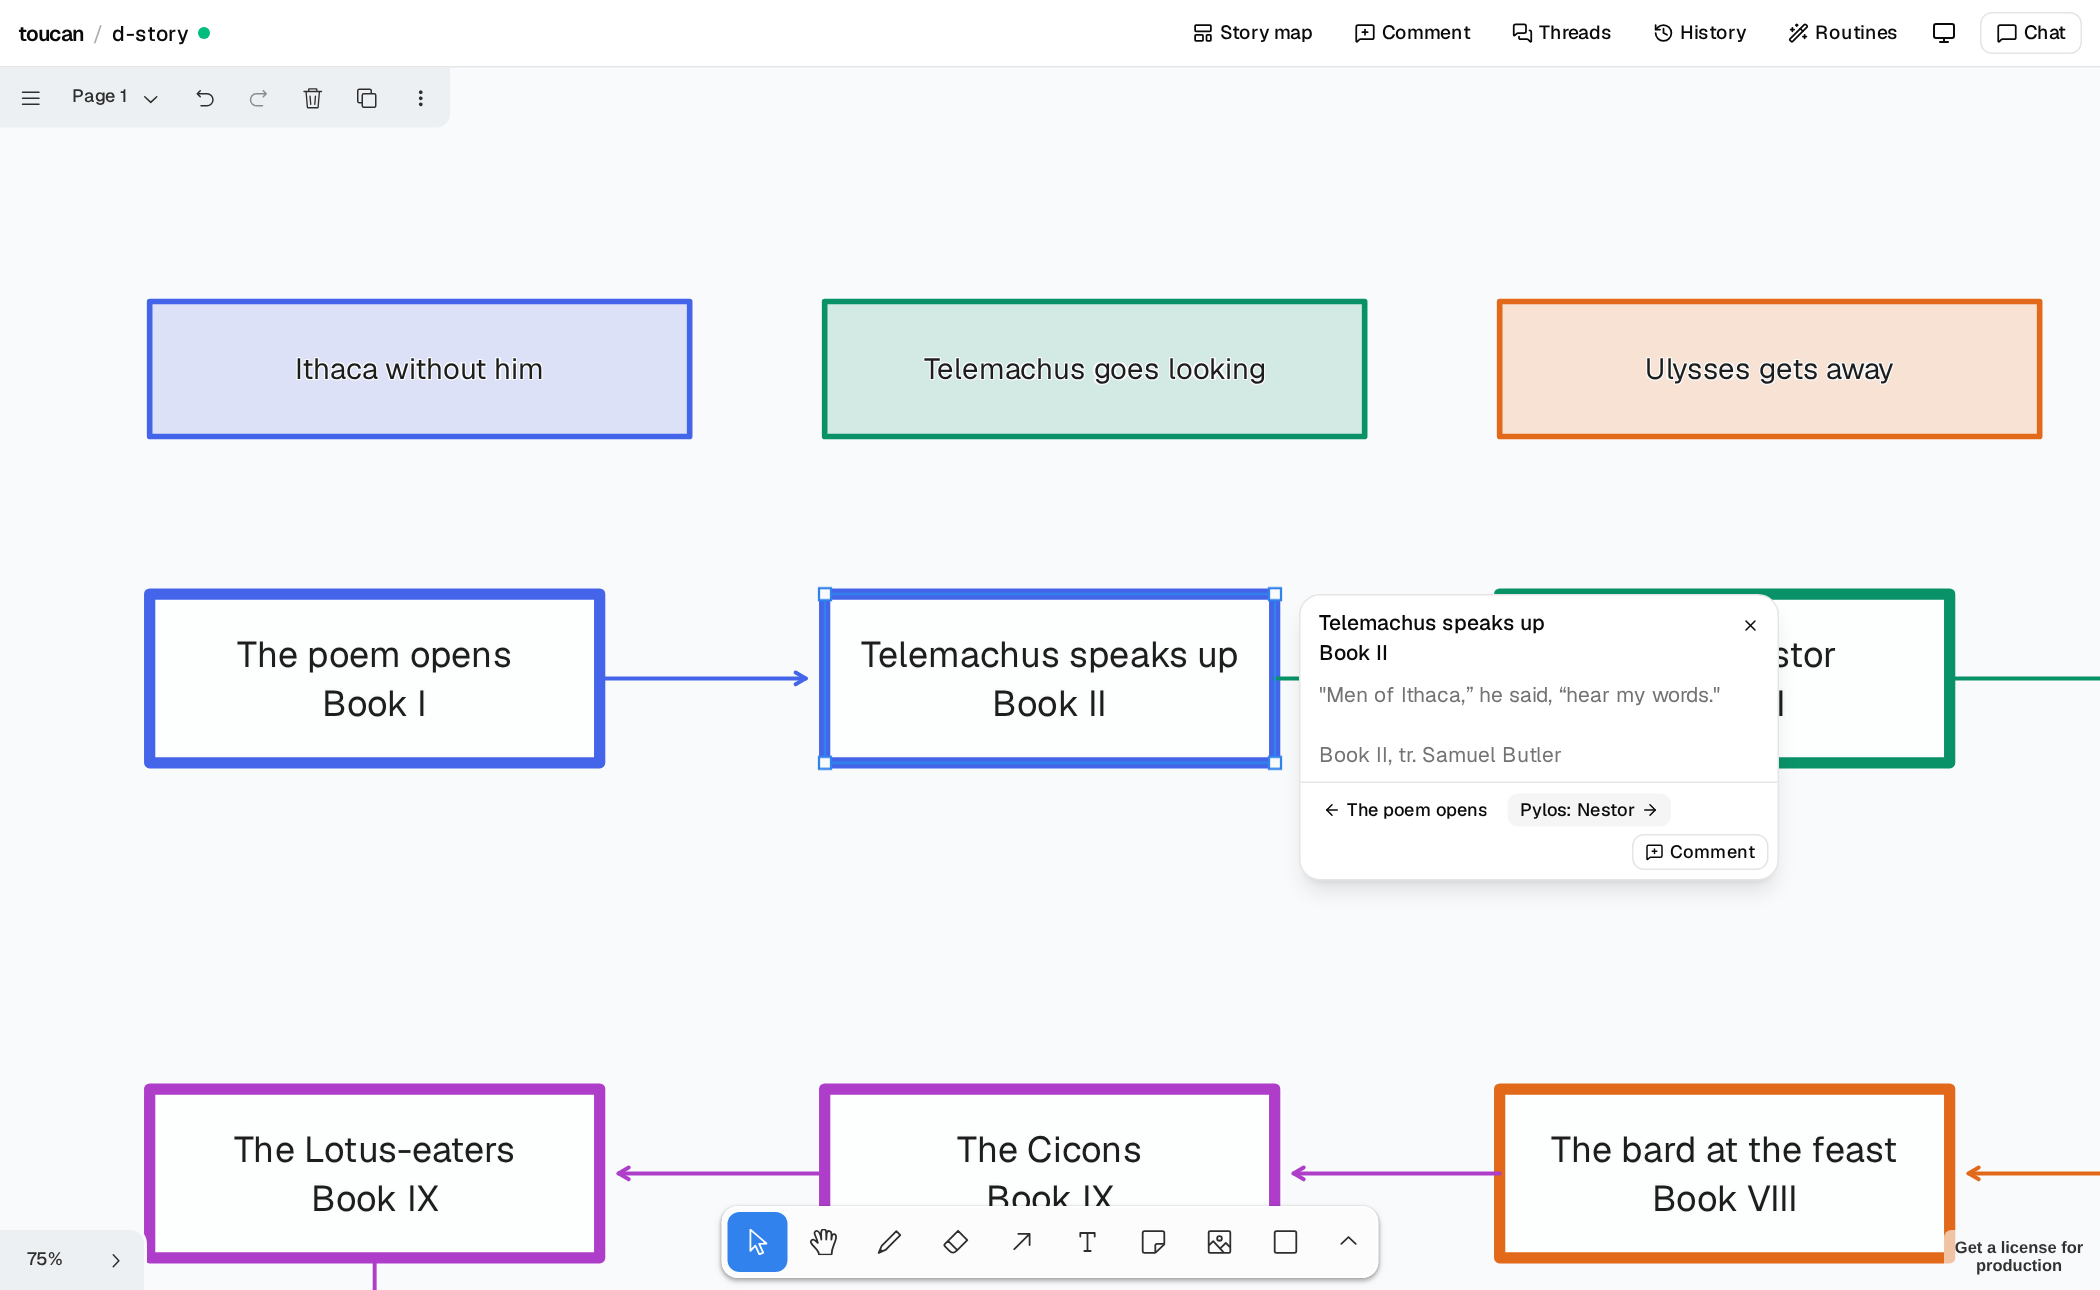
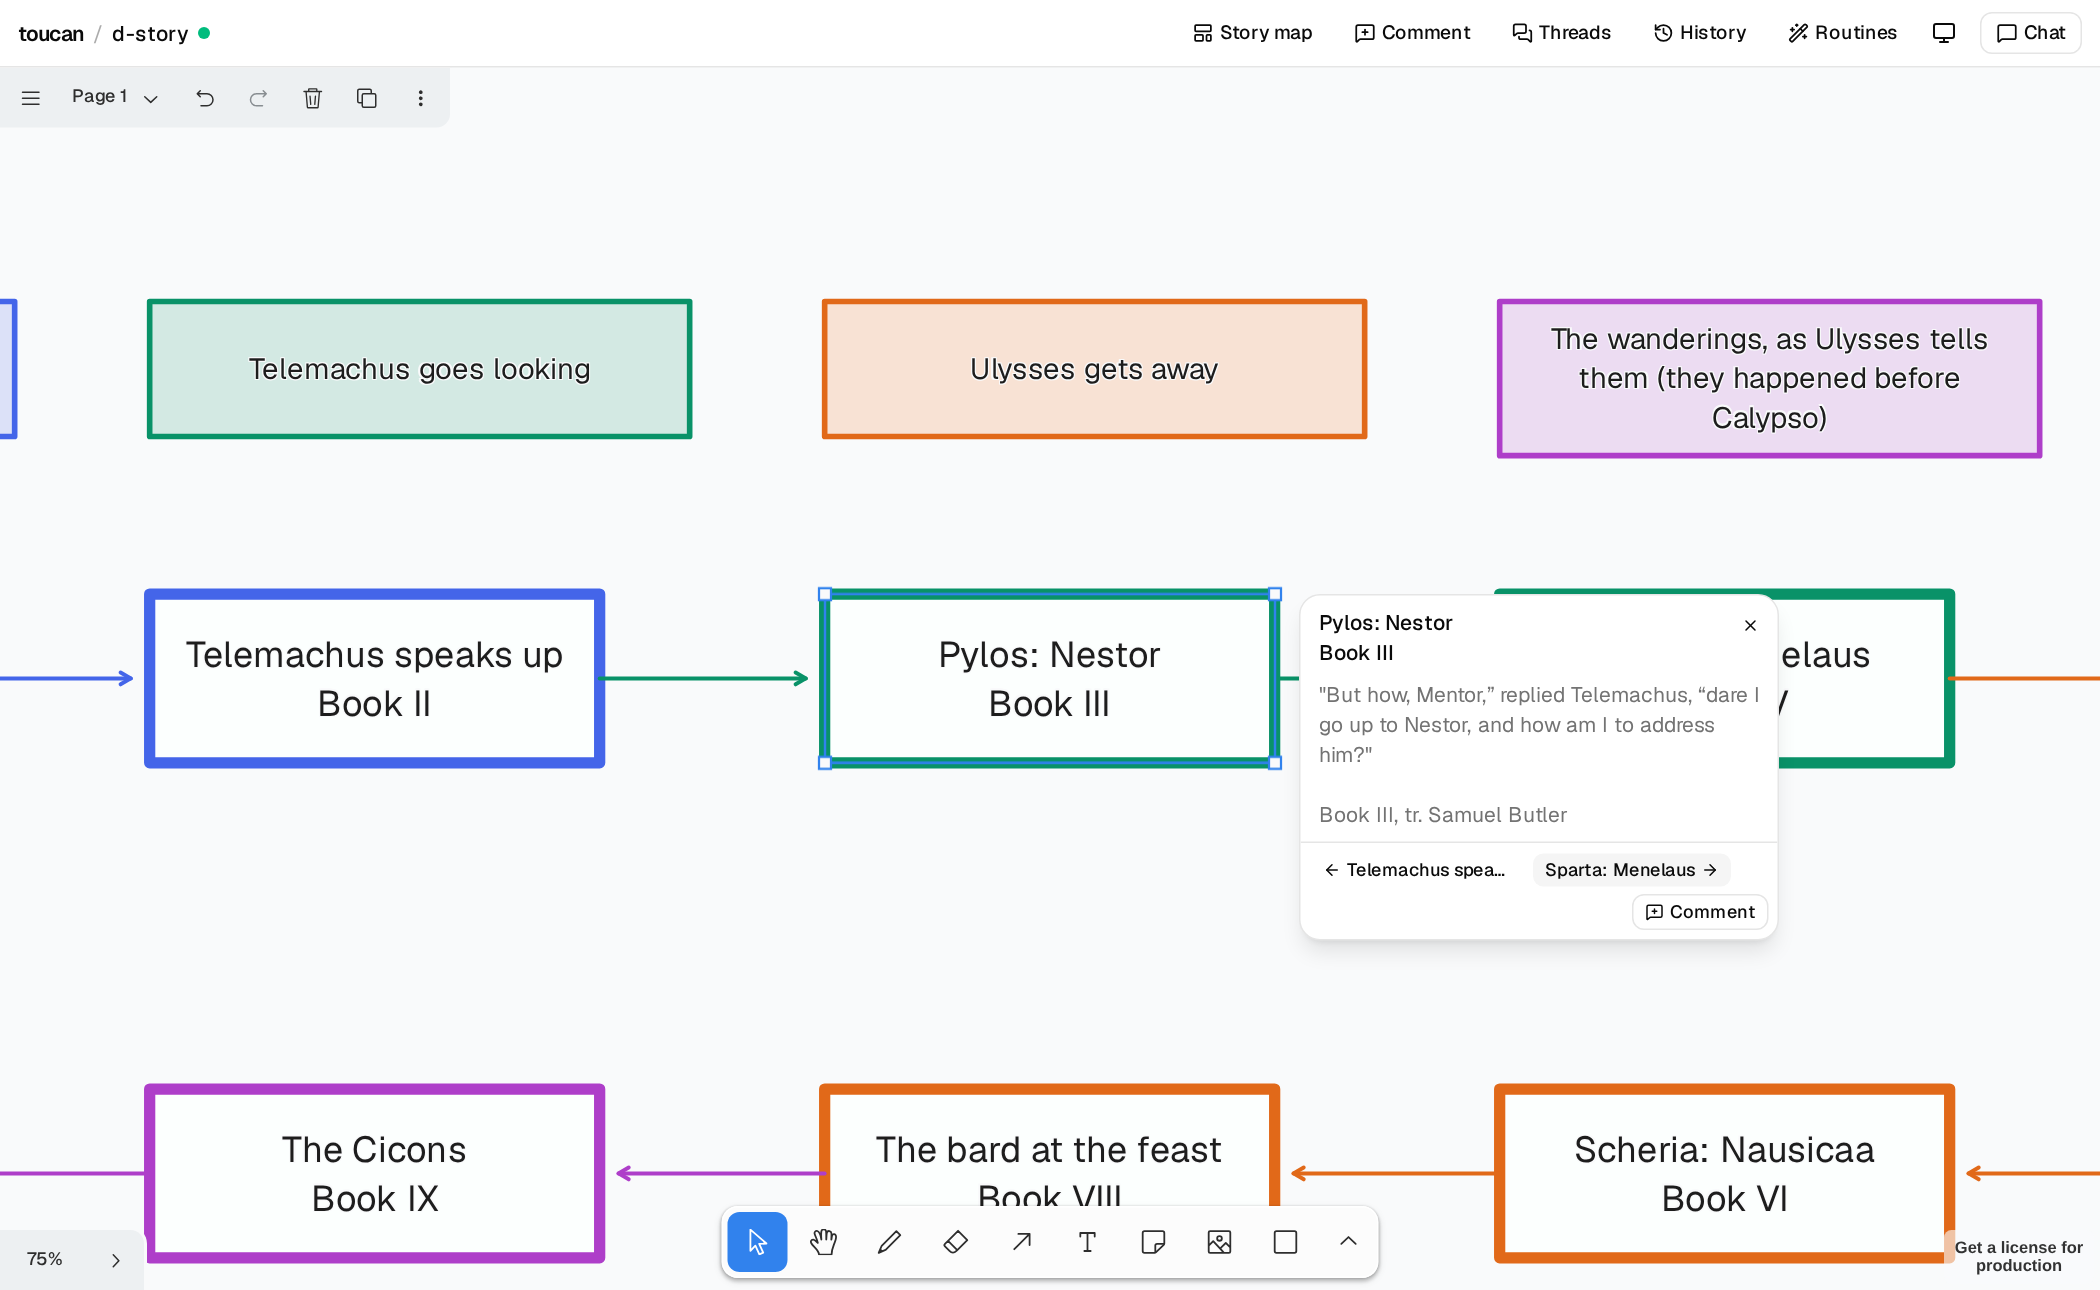
Try this one yourself, no install needed.
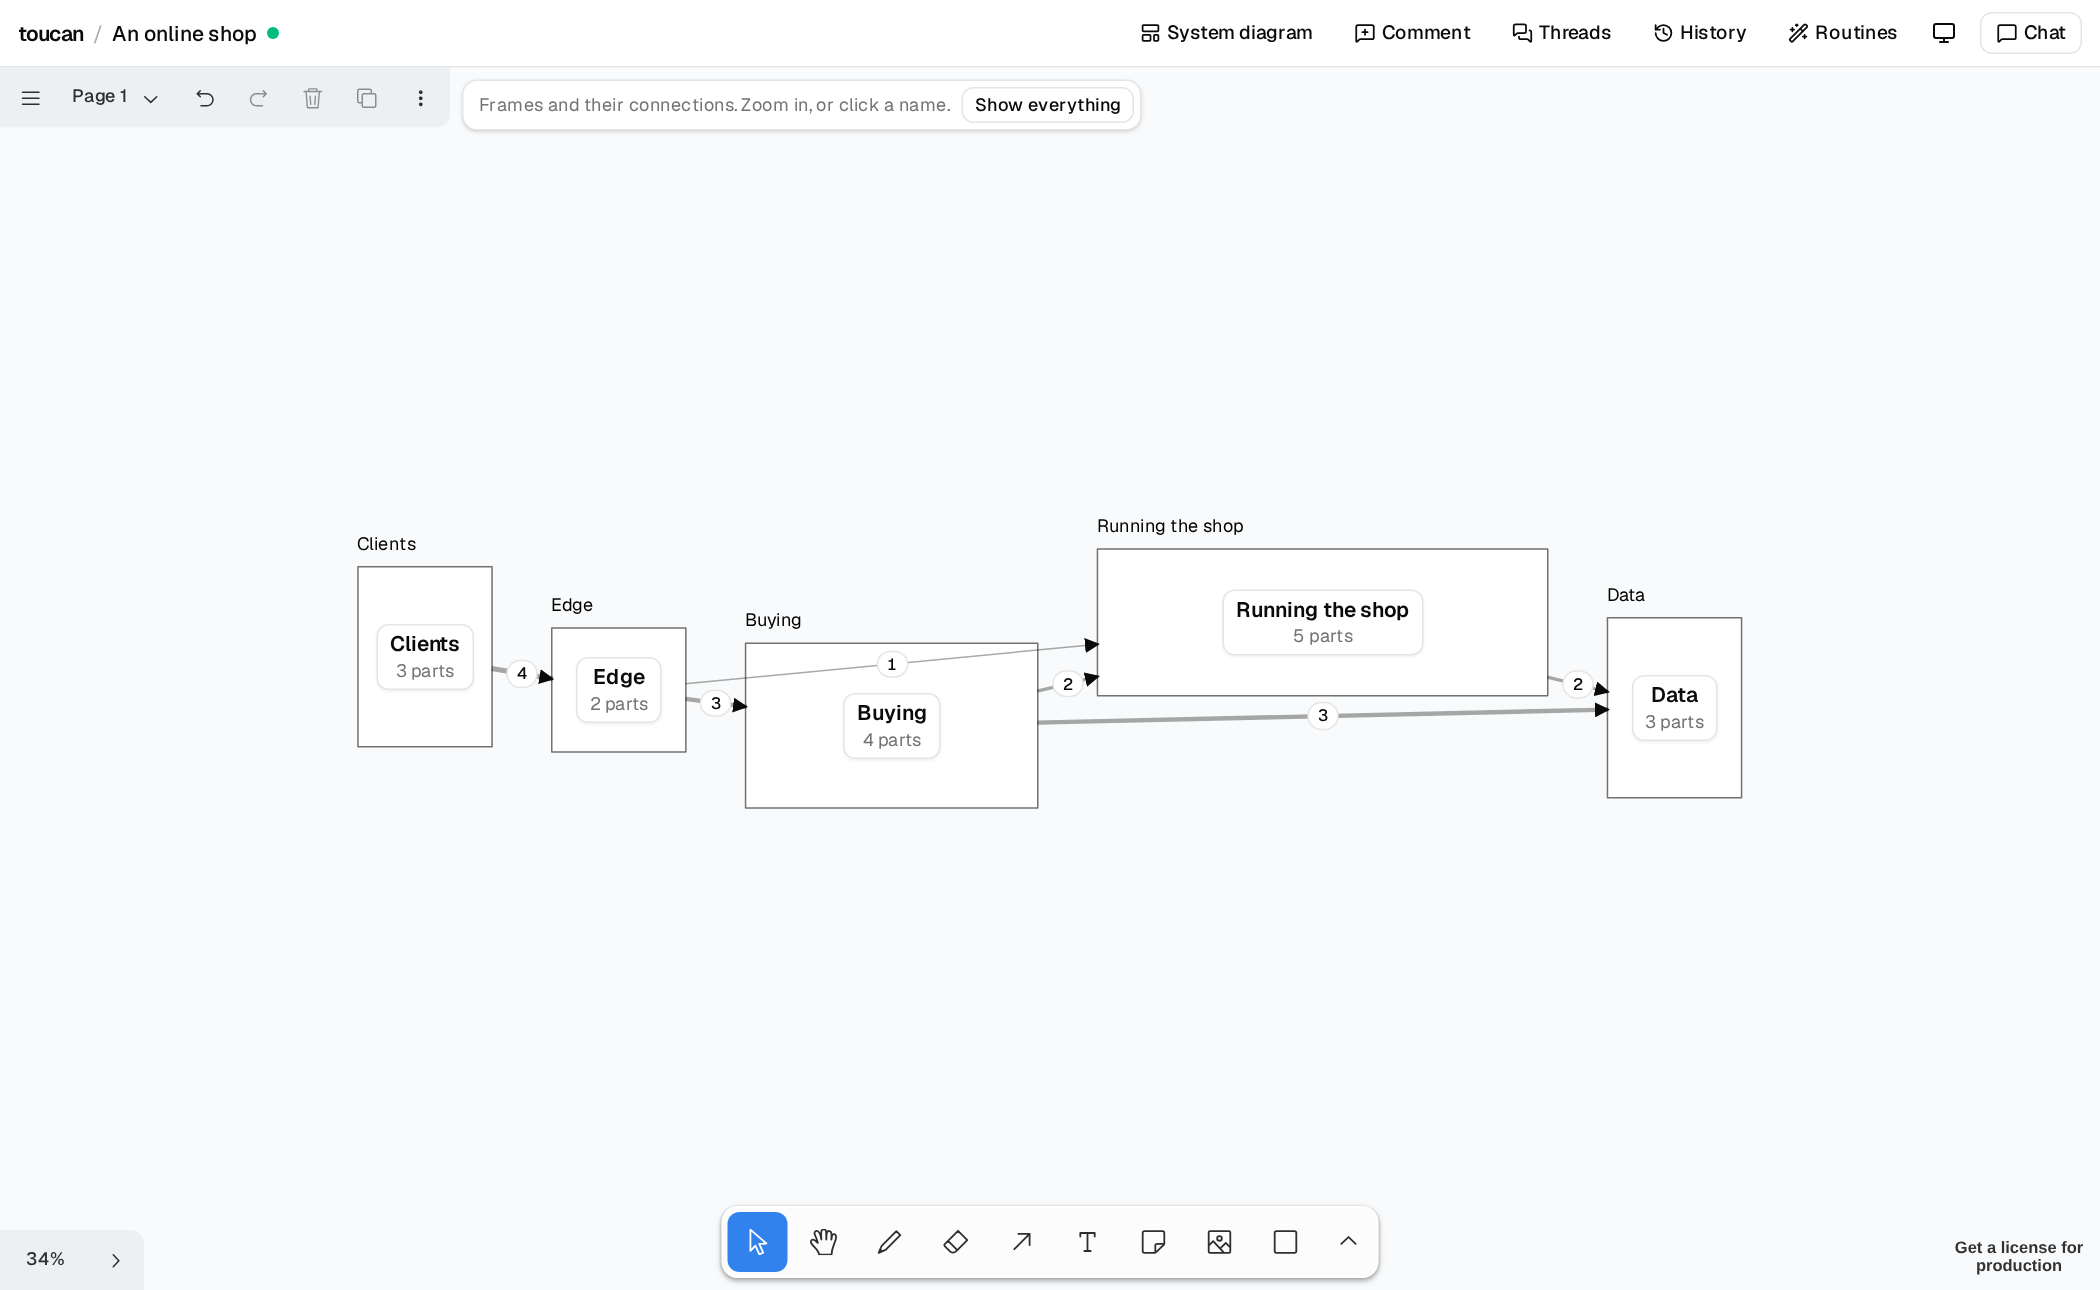
Zoom out on a system
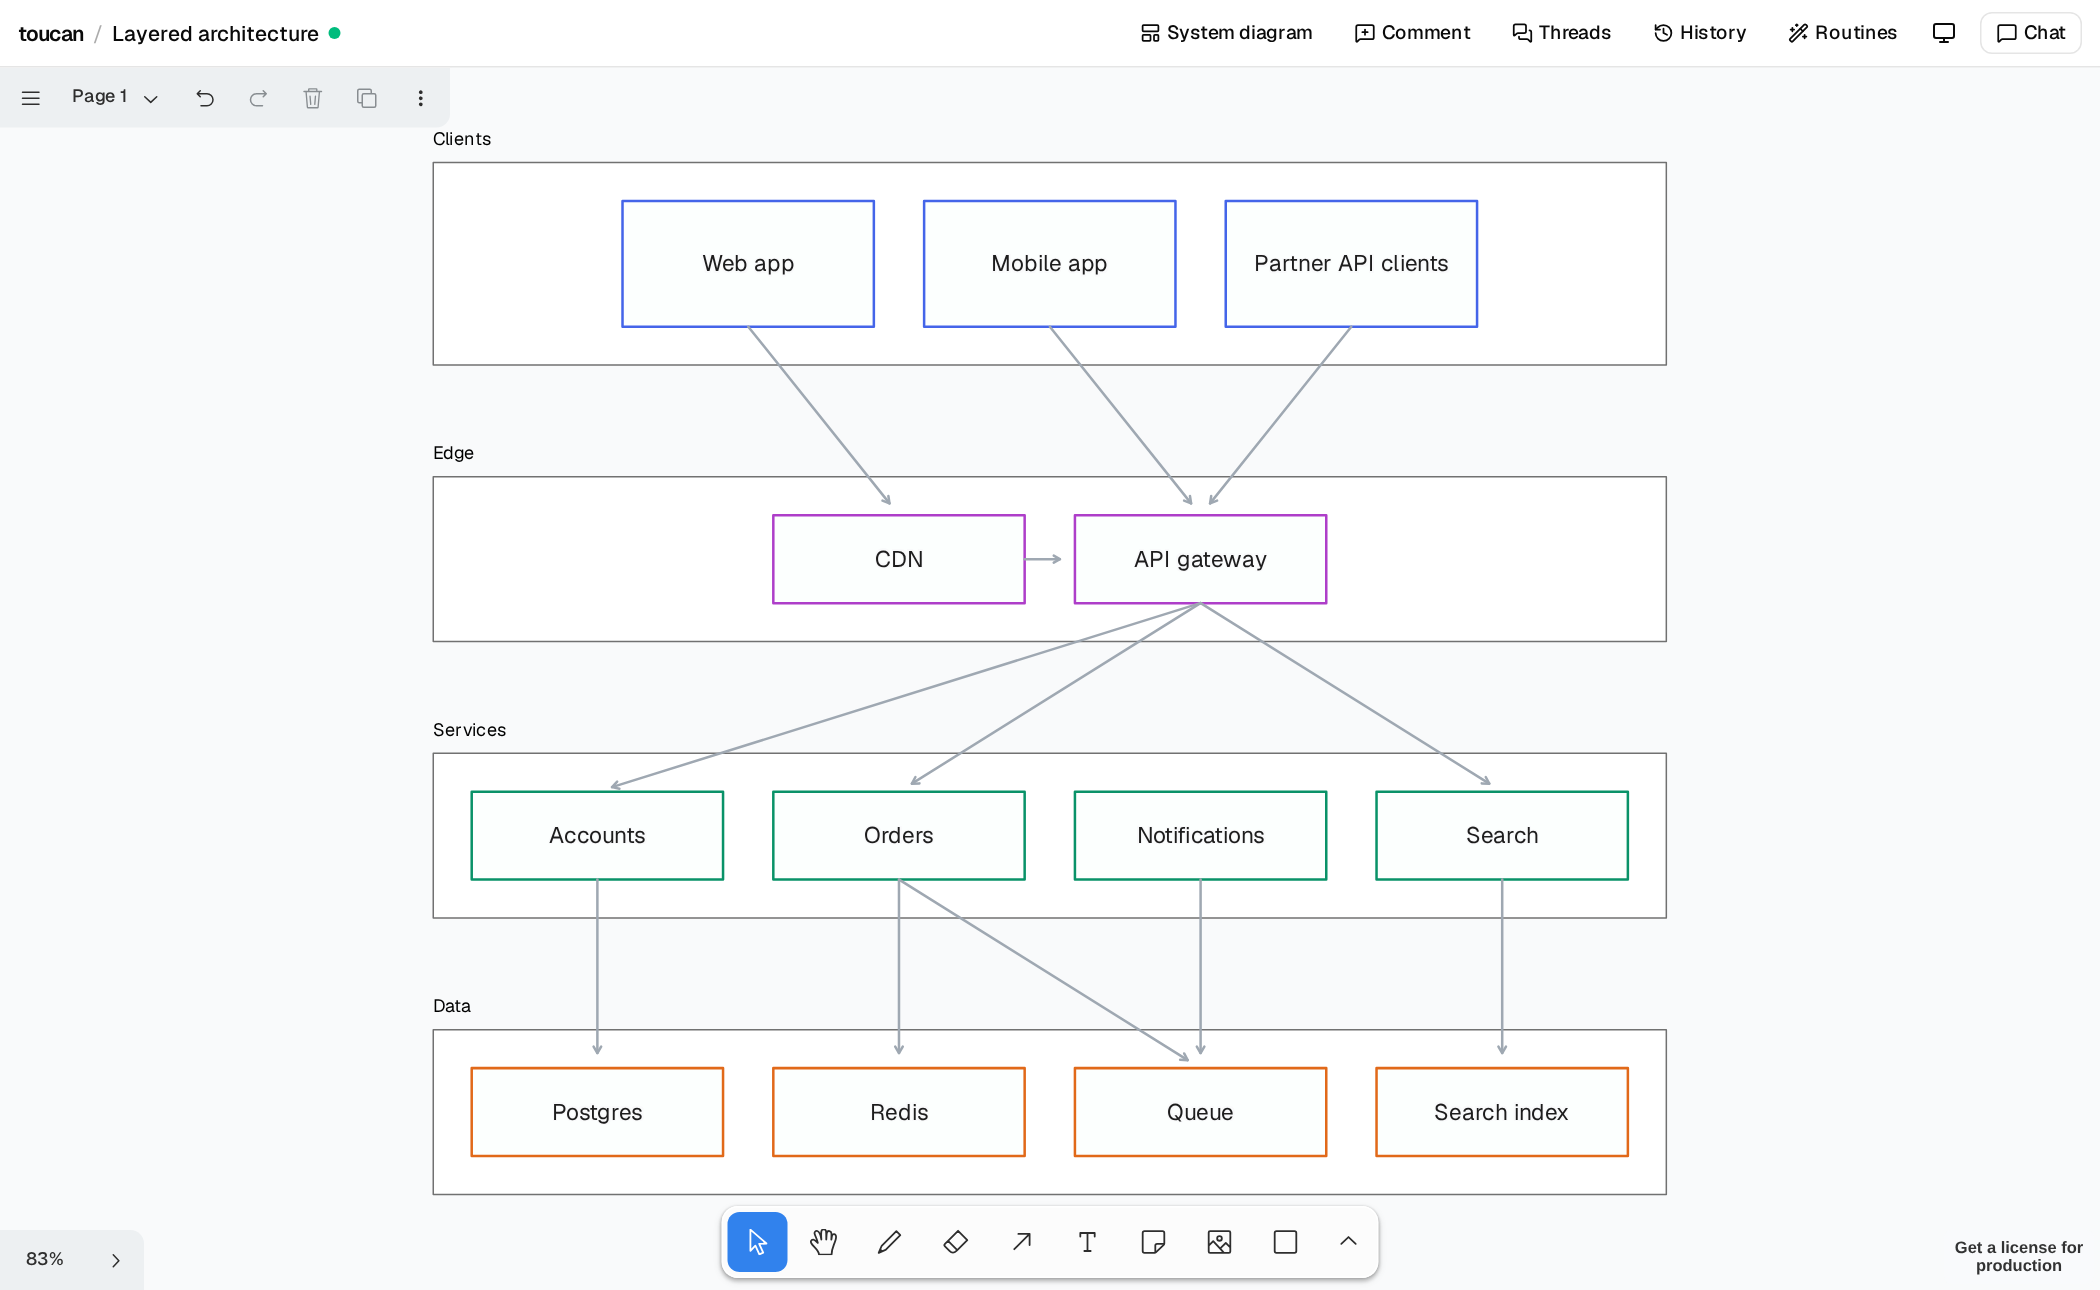
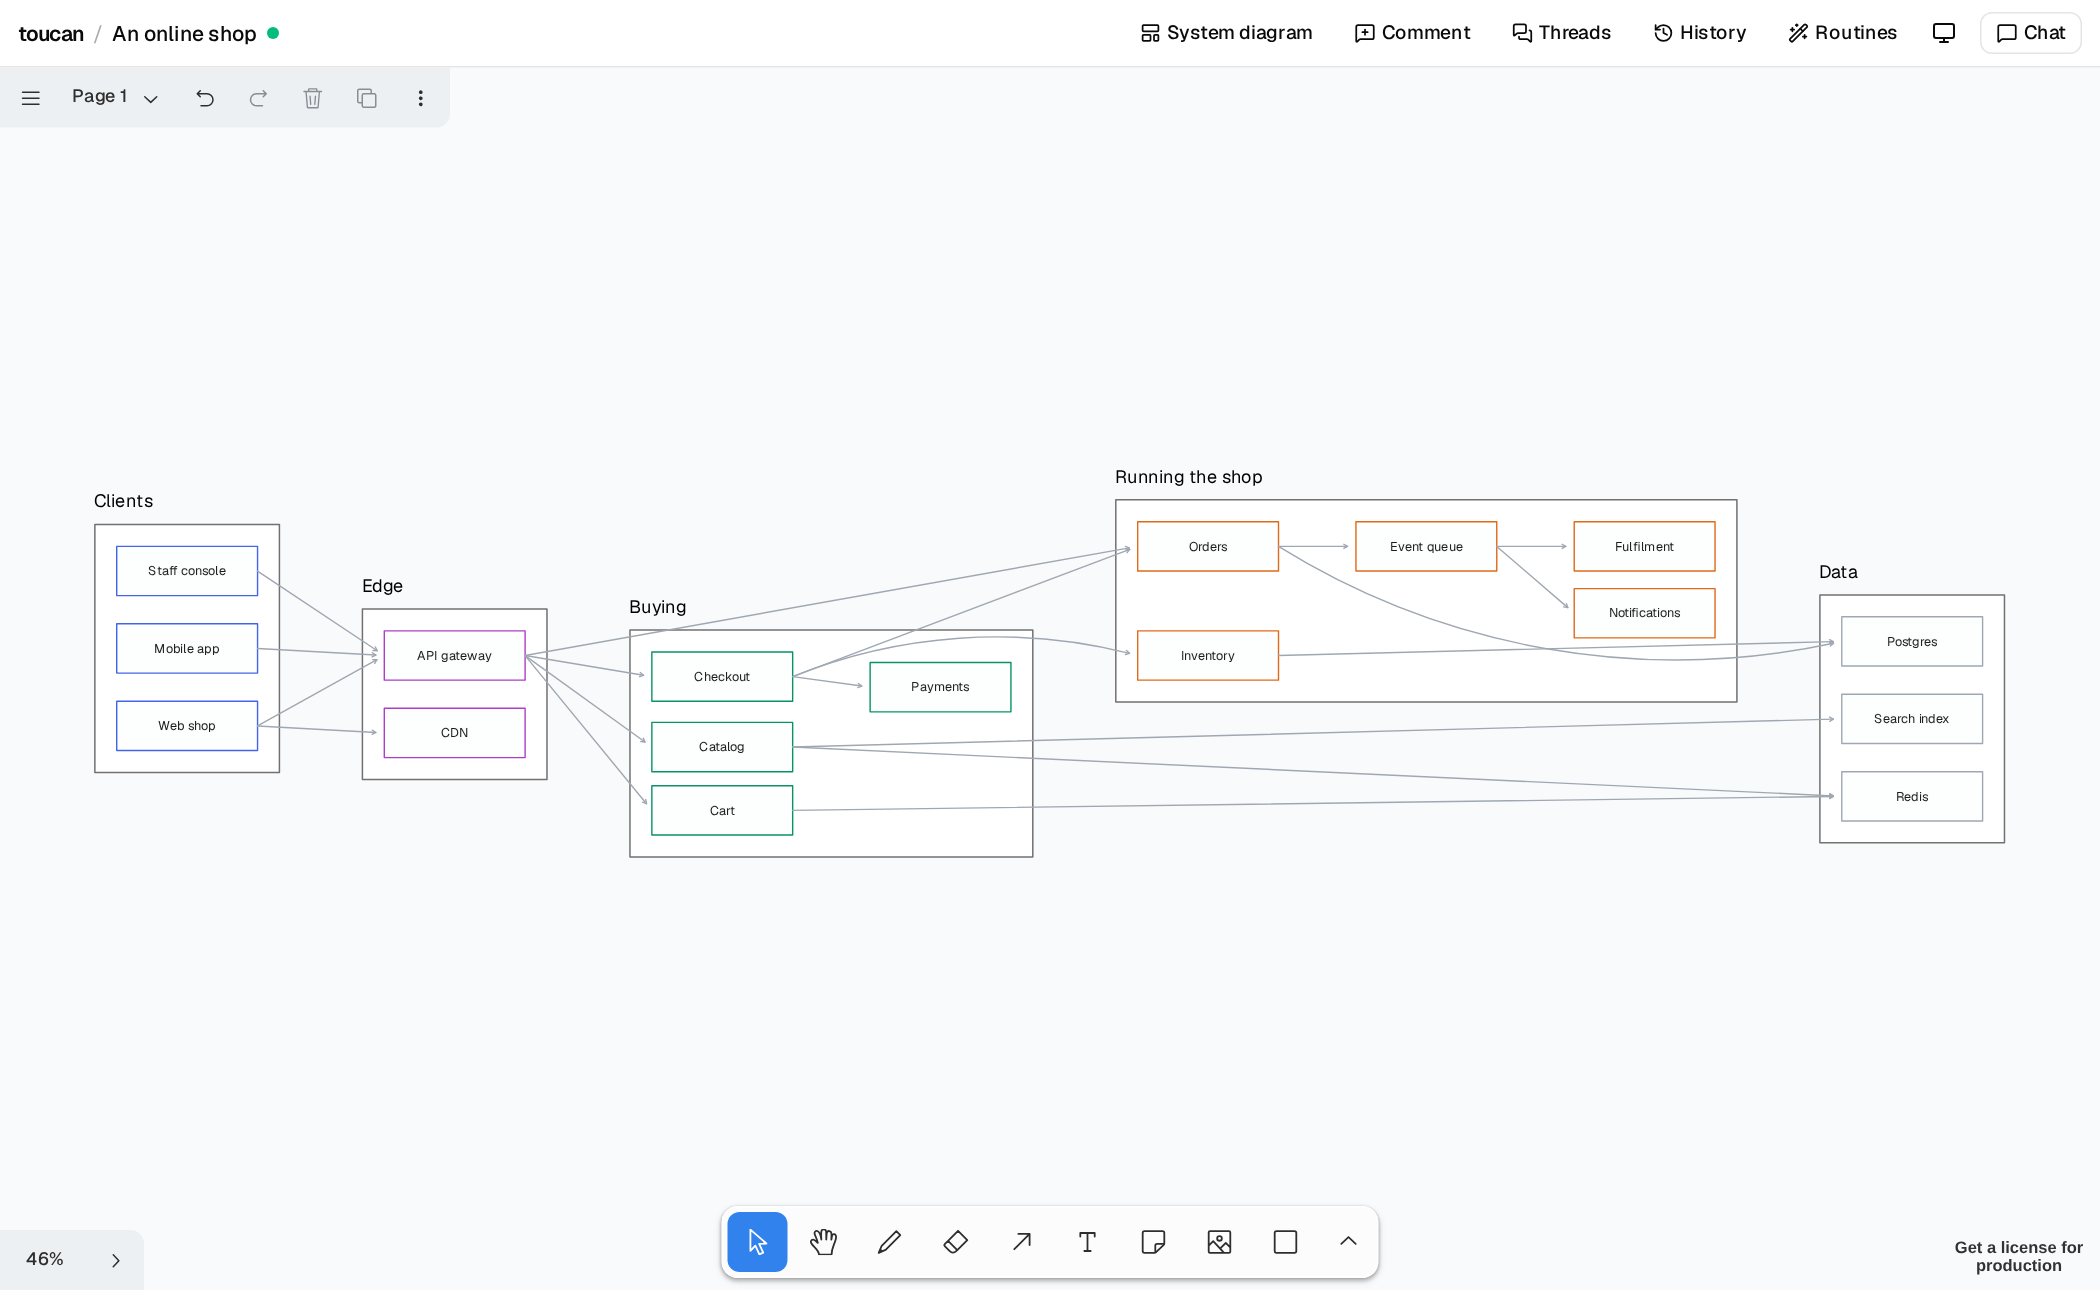
On a system diagram, zooming out swaps the details for what matters at that height: the frames, how many parts each holds, and how many connections run between them. It only changes what you see; agents and exports still get every shape.
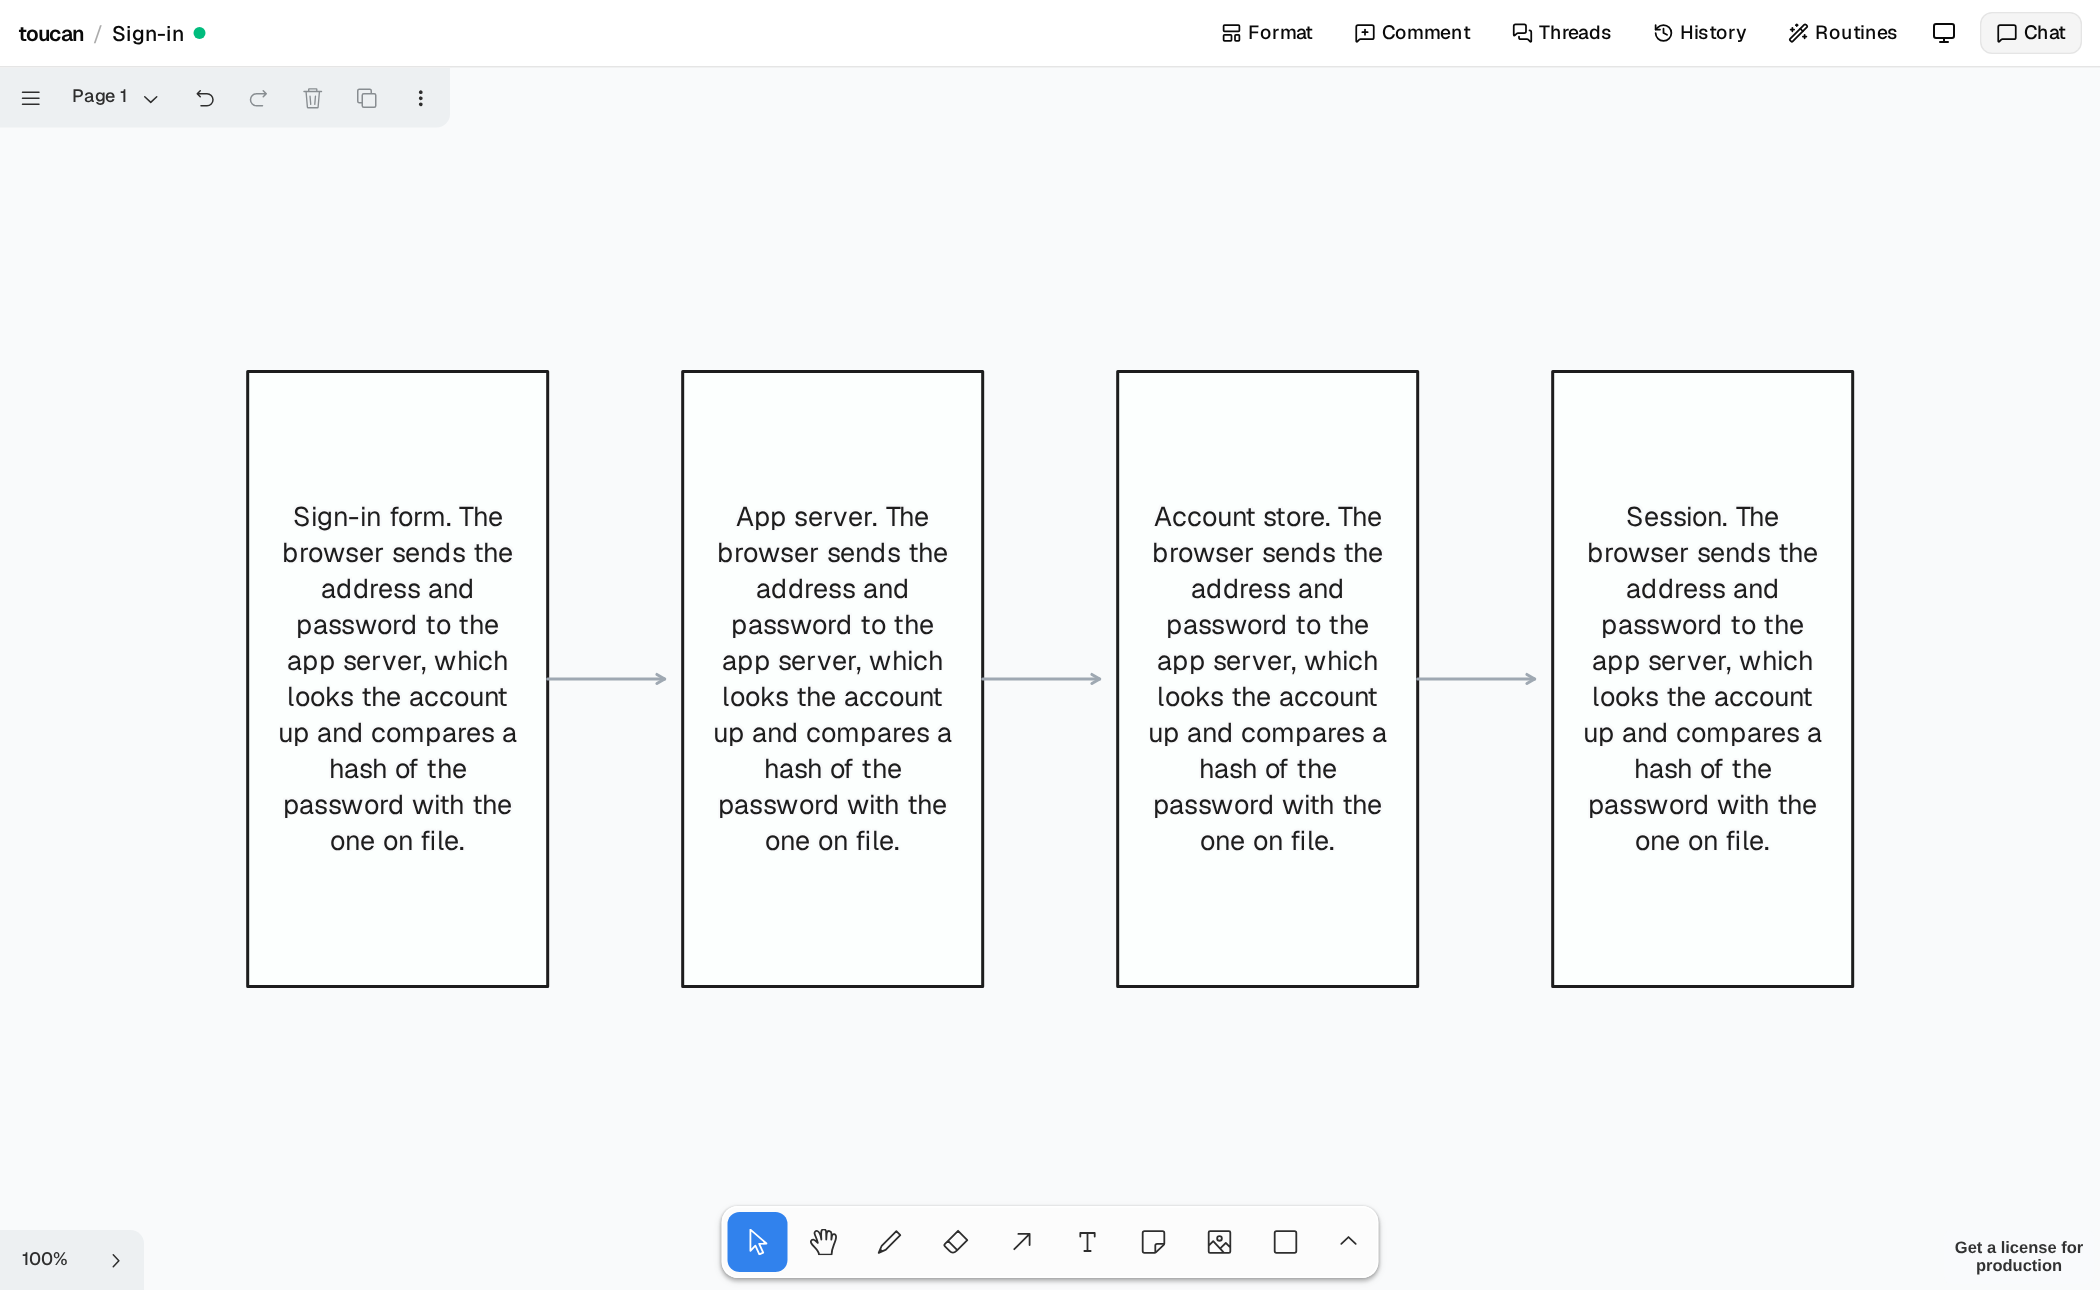
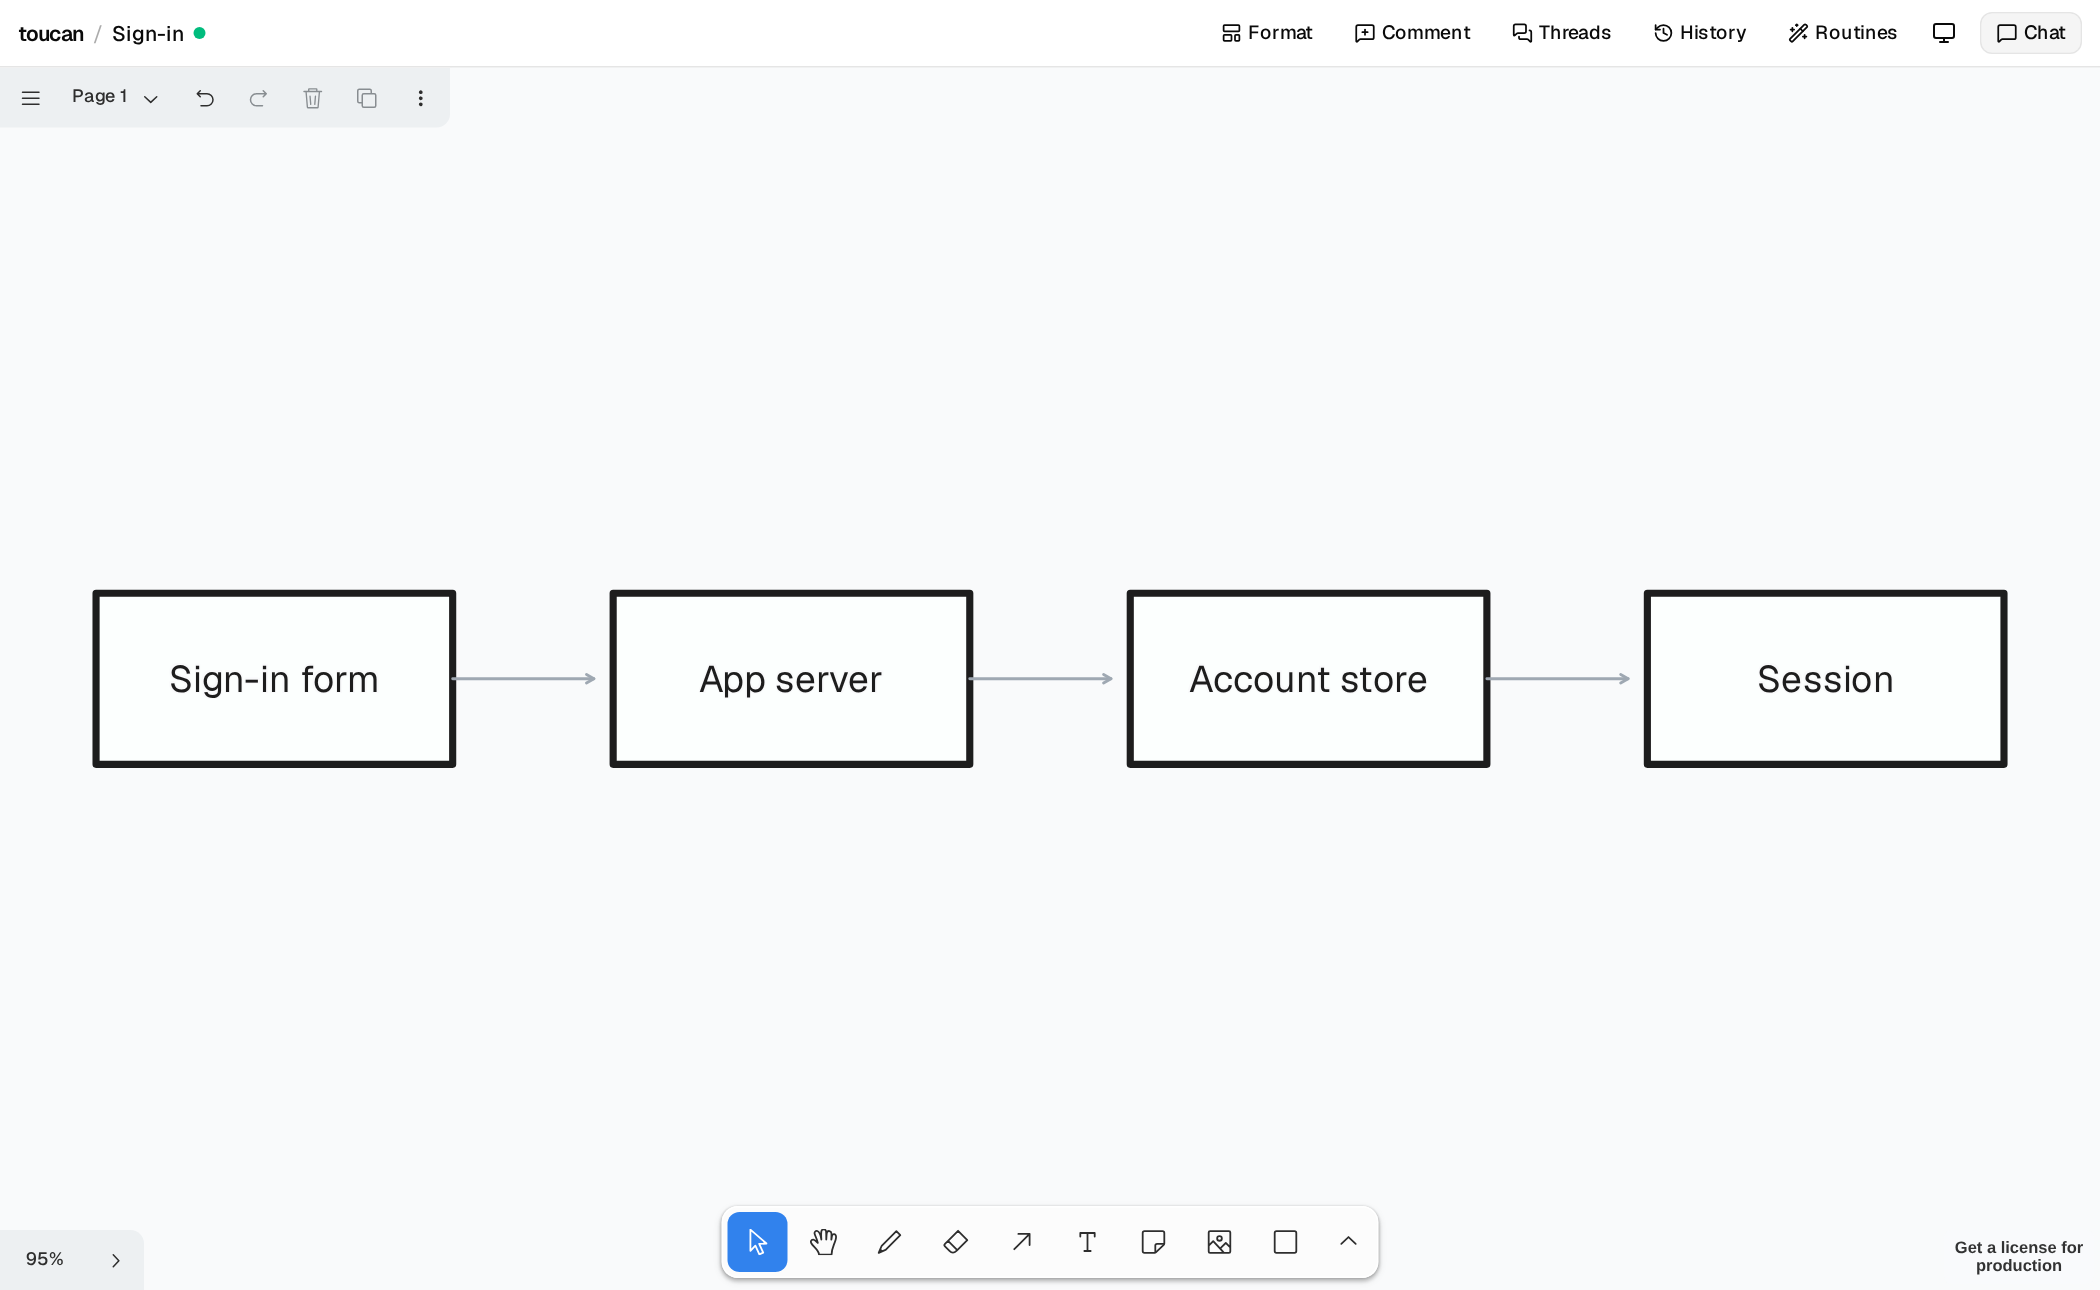
Air out a dense diagram
Long text in boxes makes a canvas hard to read and hard to talk about. The Air out routine moves it into the details, makes the names larger, and spreads things a little.
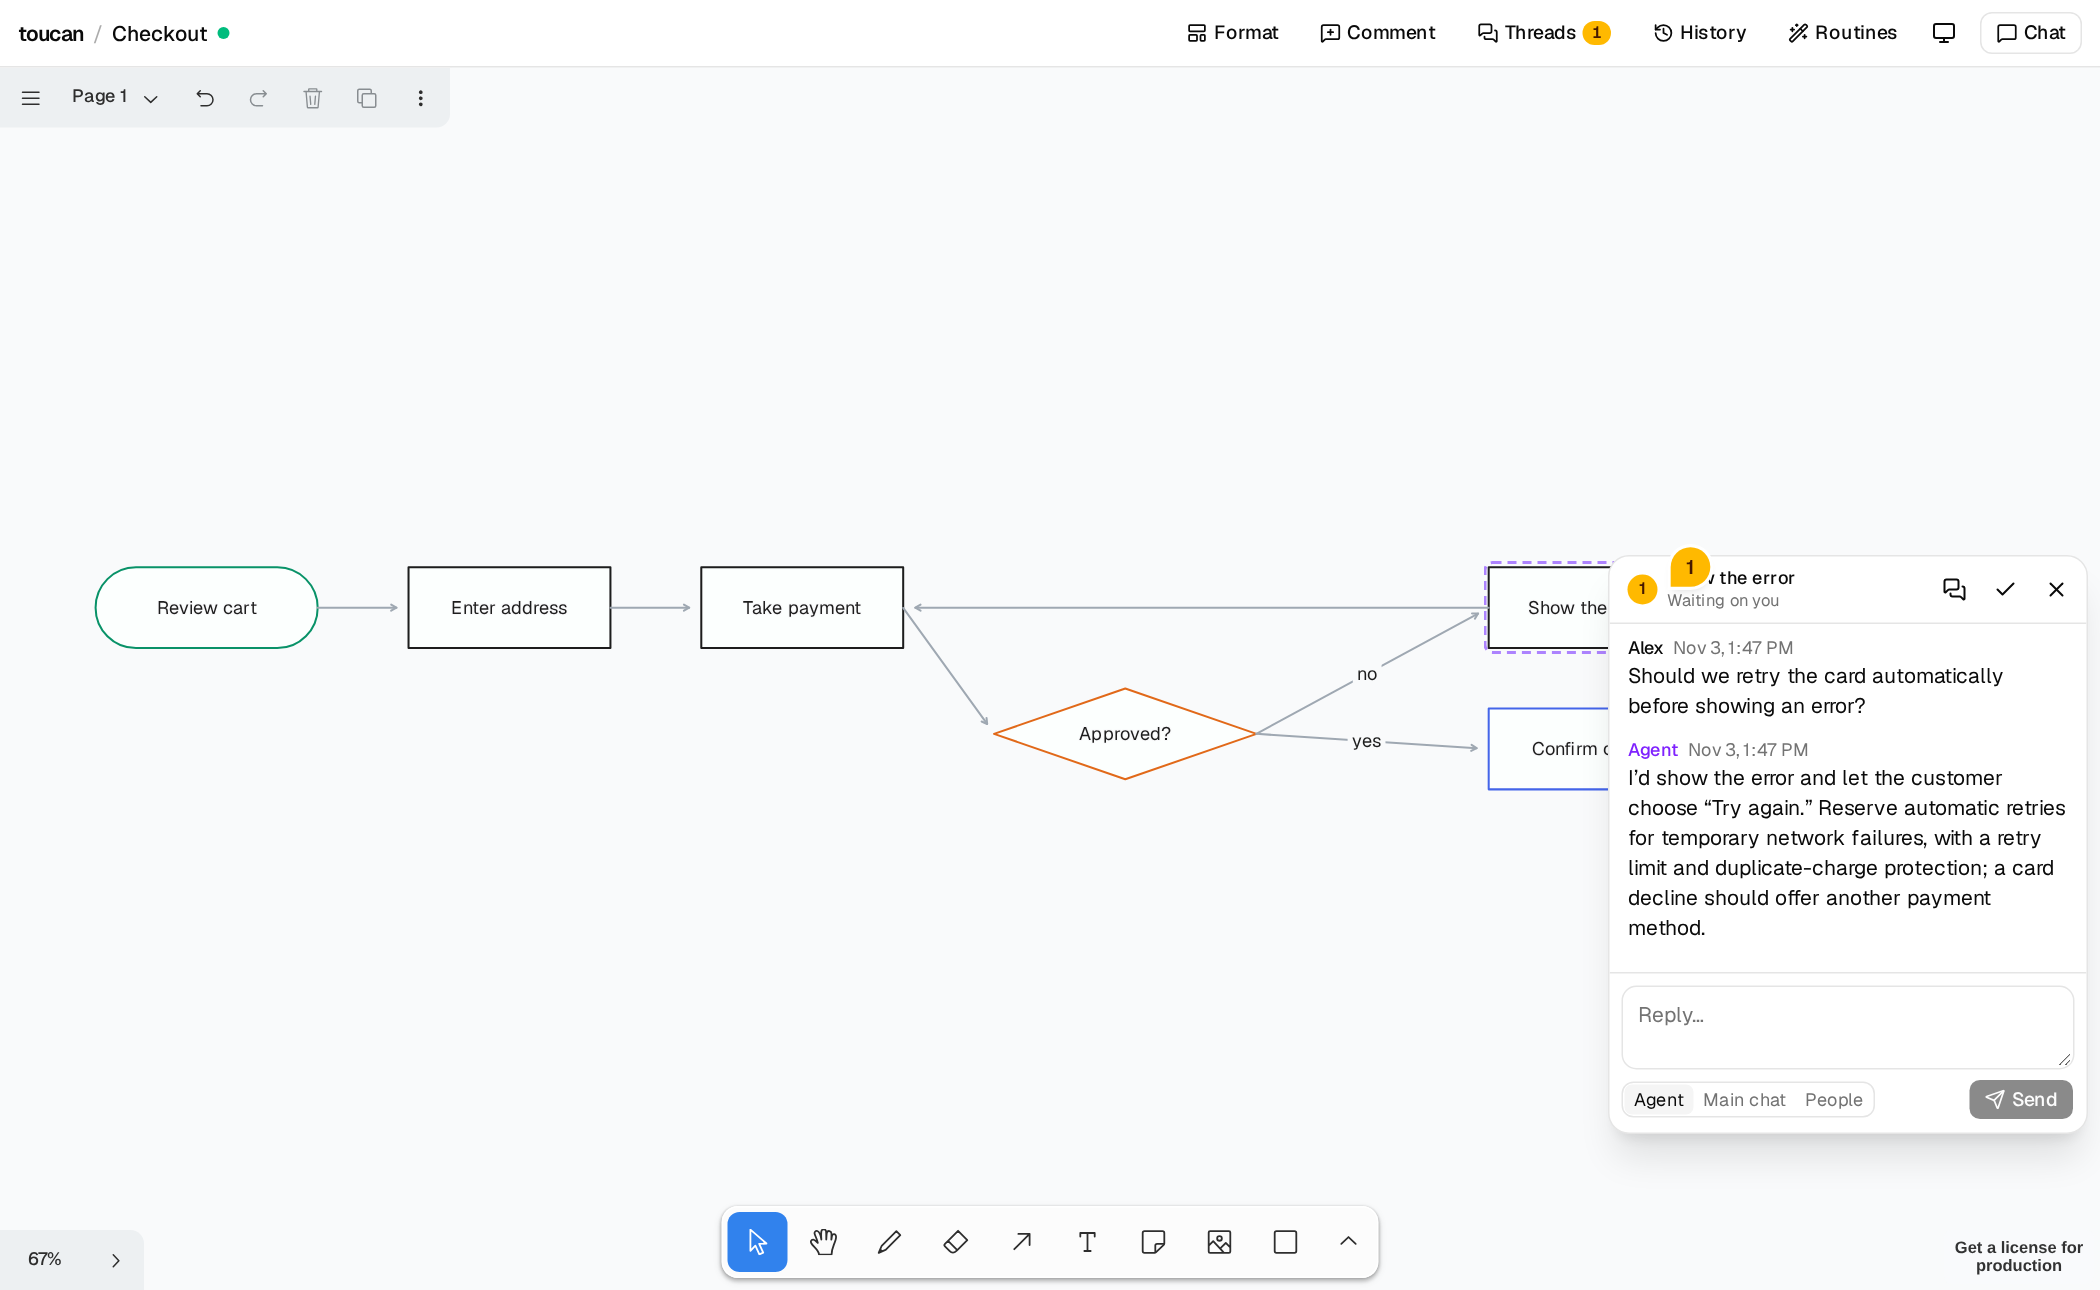
Comment, and have it answered
A comment on a box or a region is a thread: a back-and-forth that someone eventually closes. Send a message to the agent and it works that thread on its own, so several can run at once.
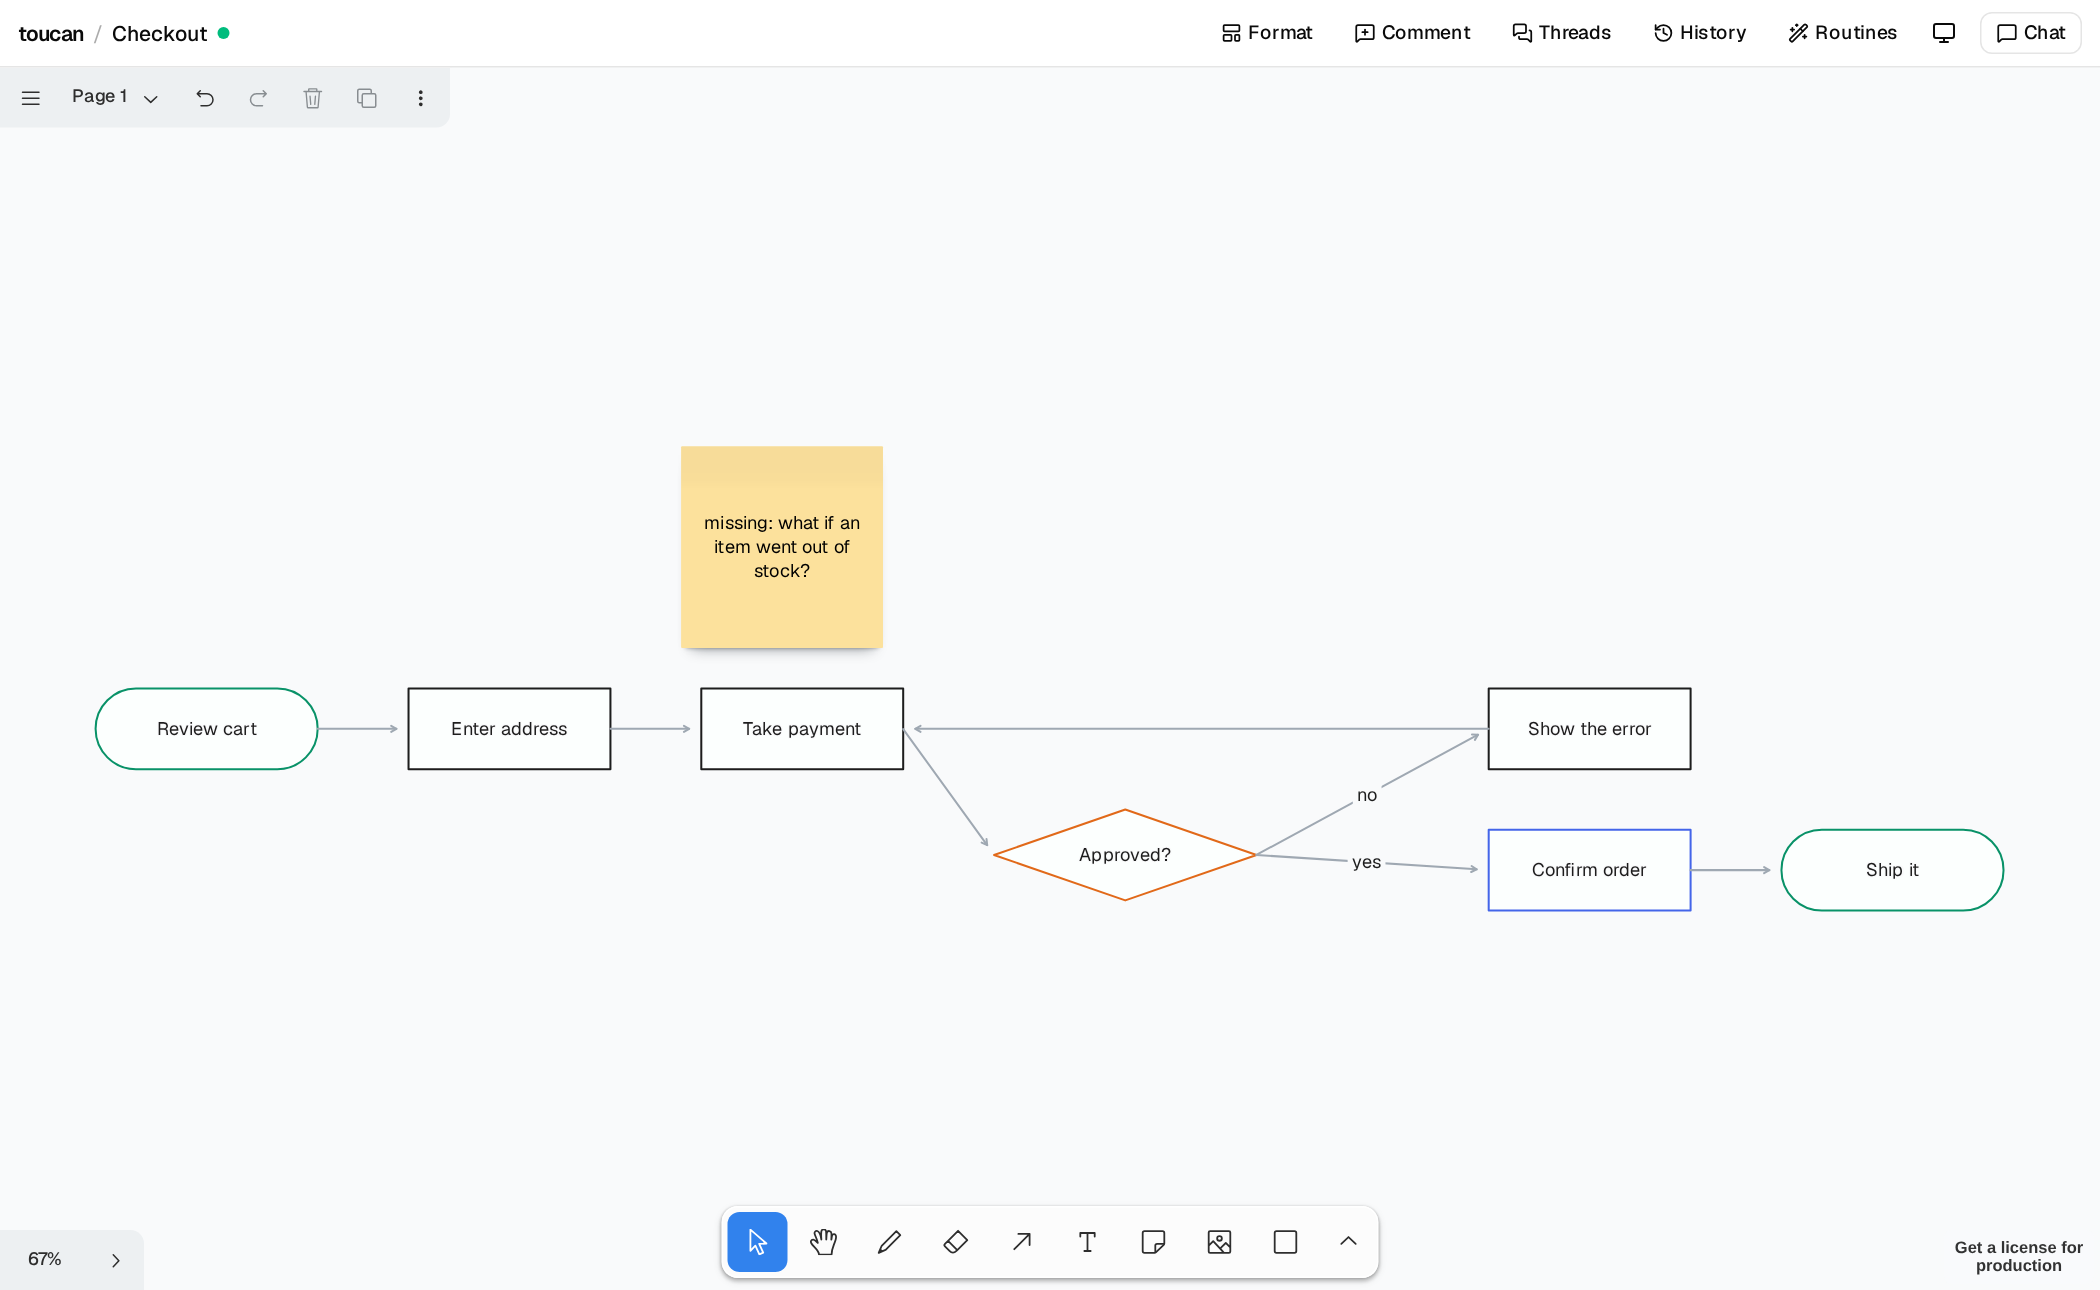
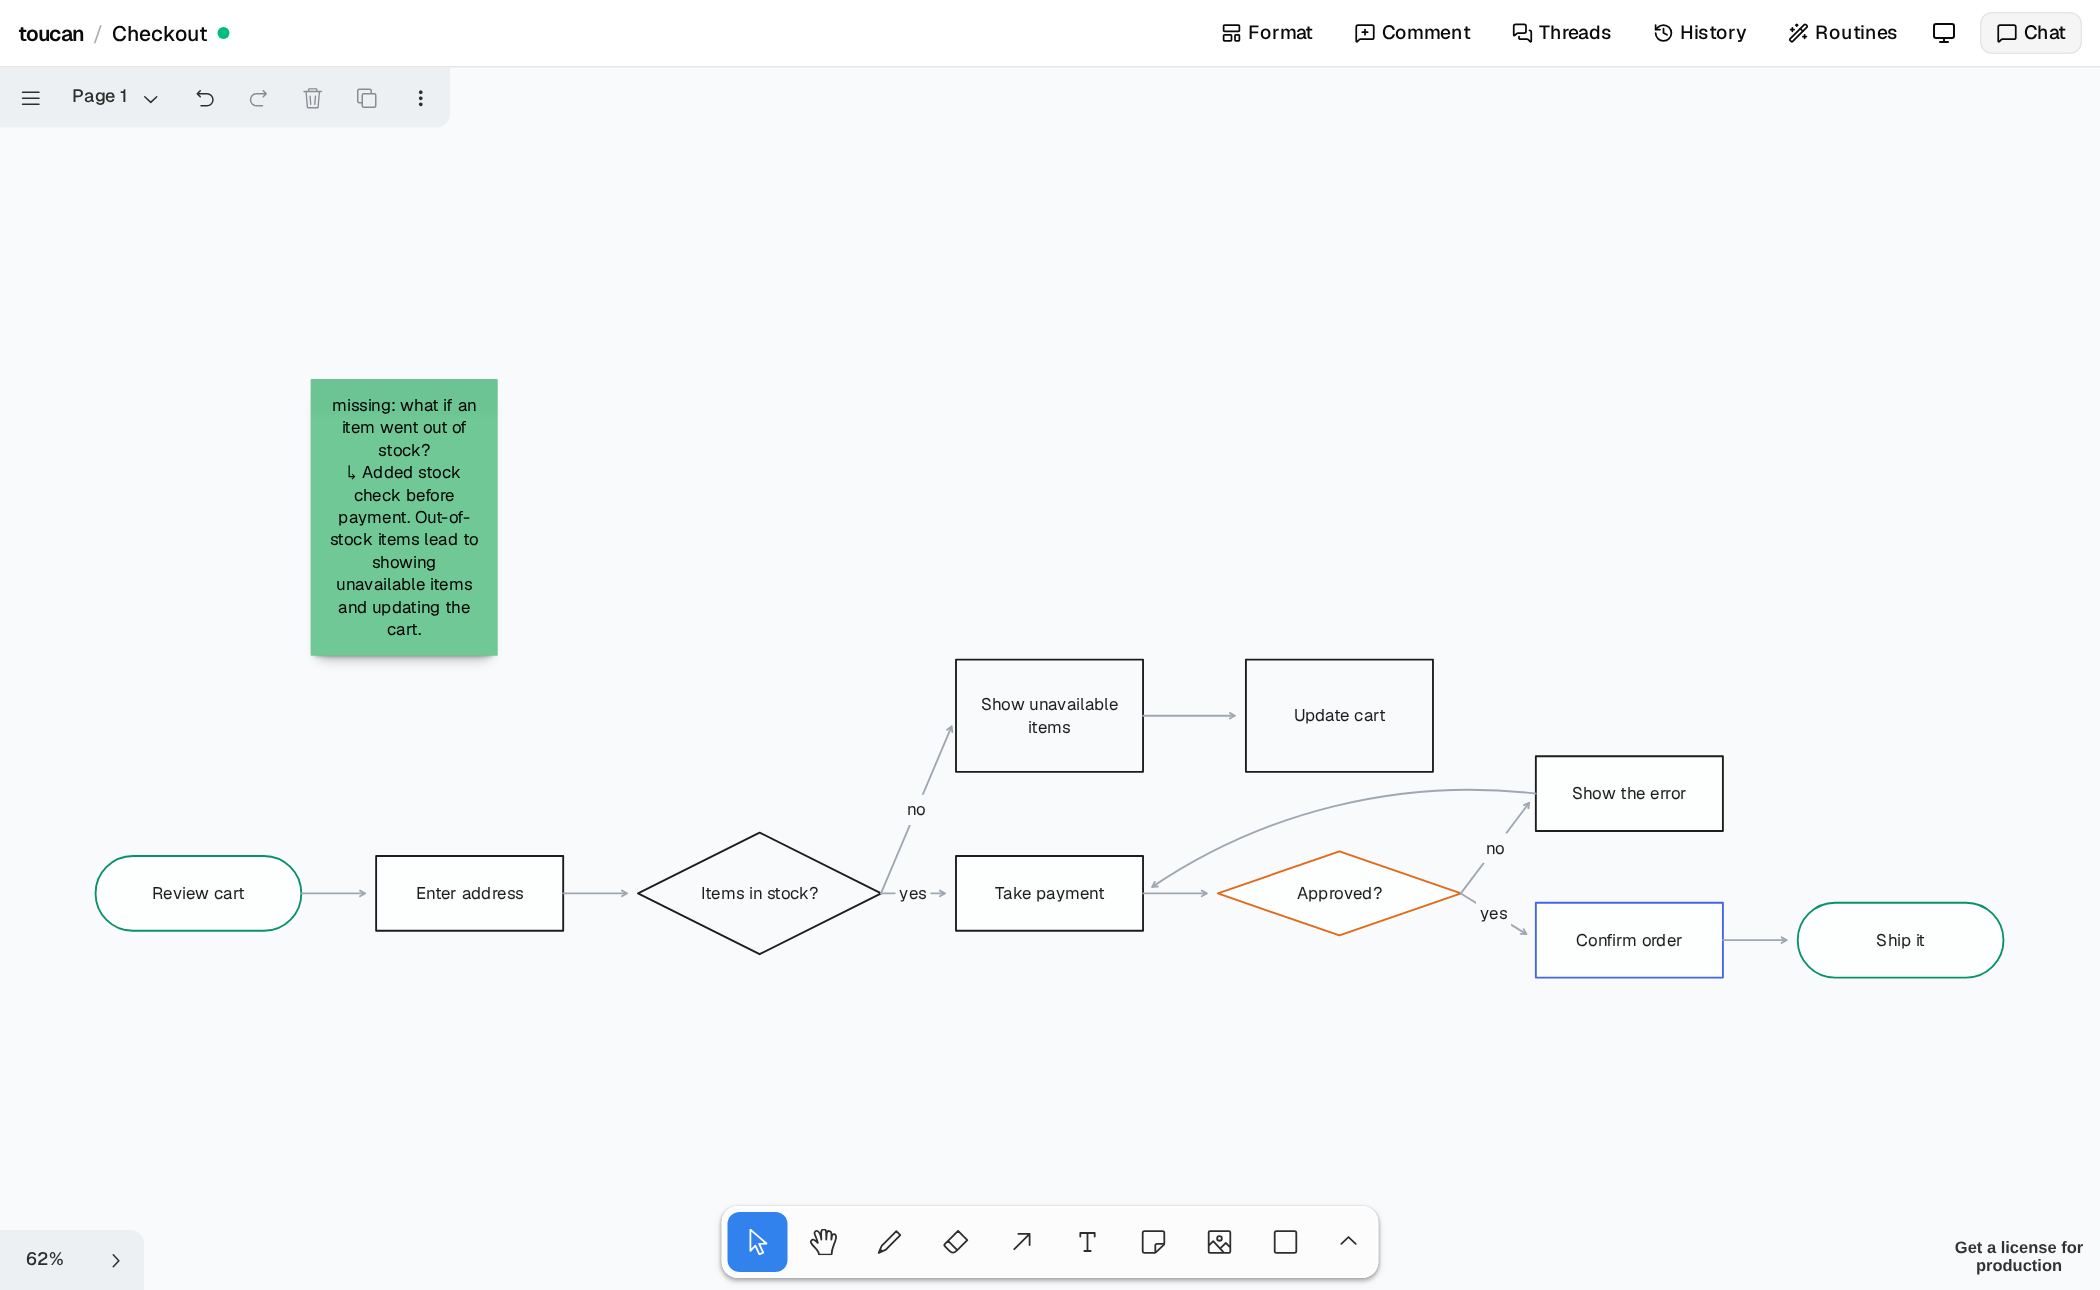
Leave a sticky note
Pin a note where the problem is instead of describing it in chat. Its position is part of the message. Asked to handle the notes, the agent acts on each one, and the note turns green with a one-line reply.
Take it or leave it
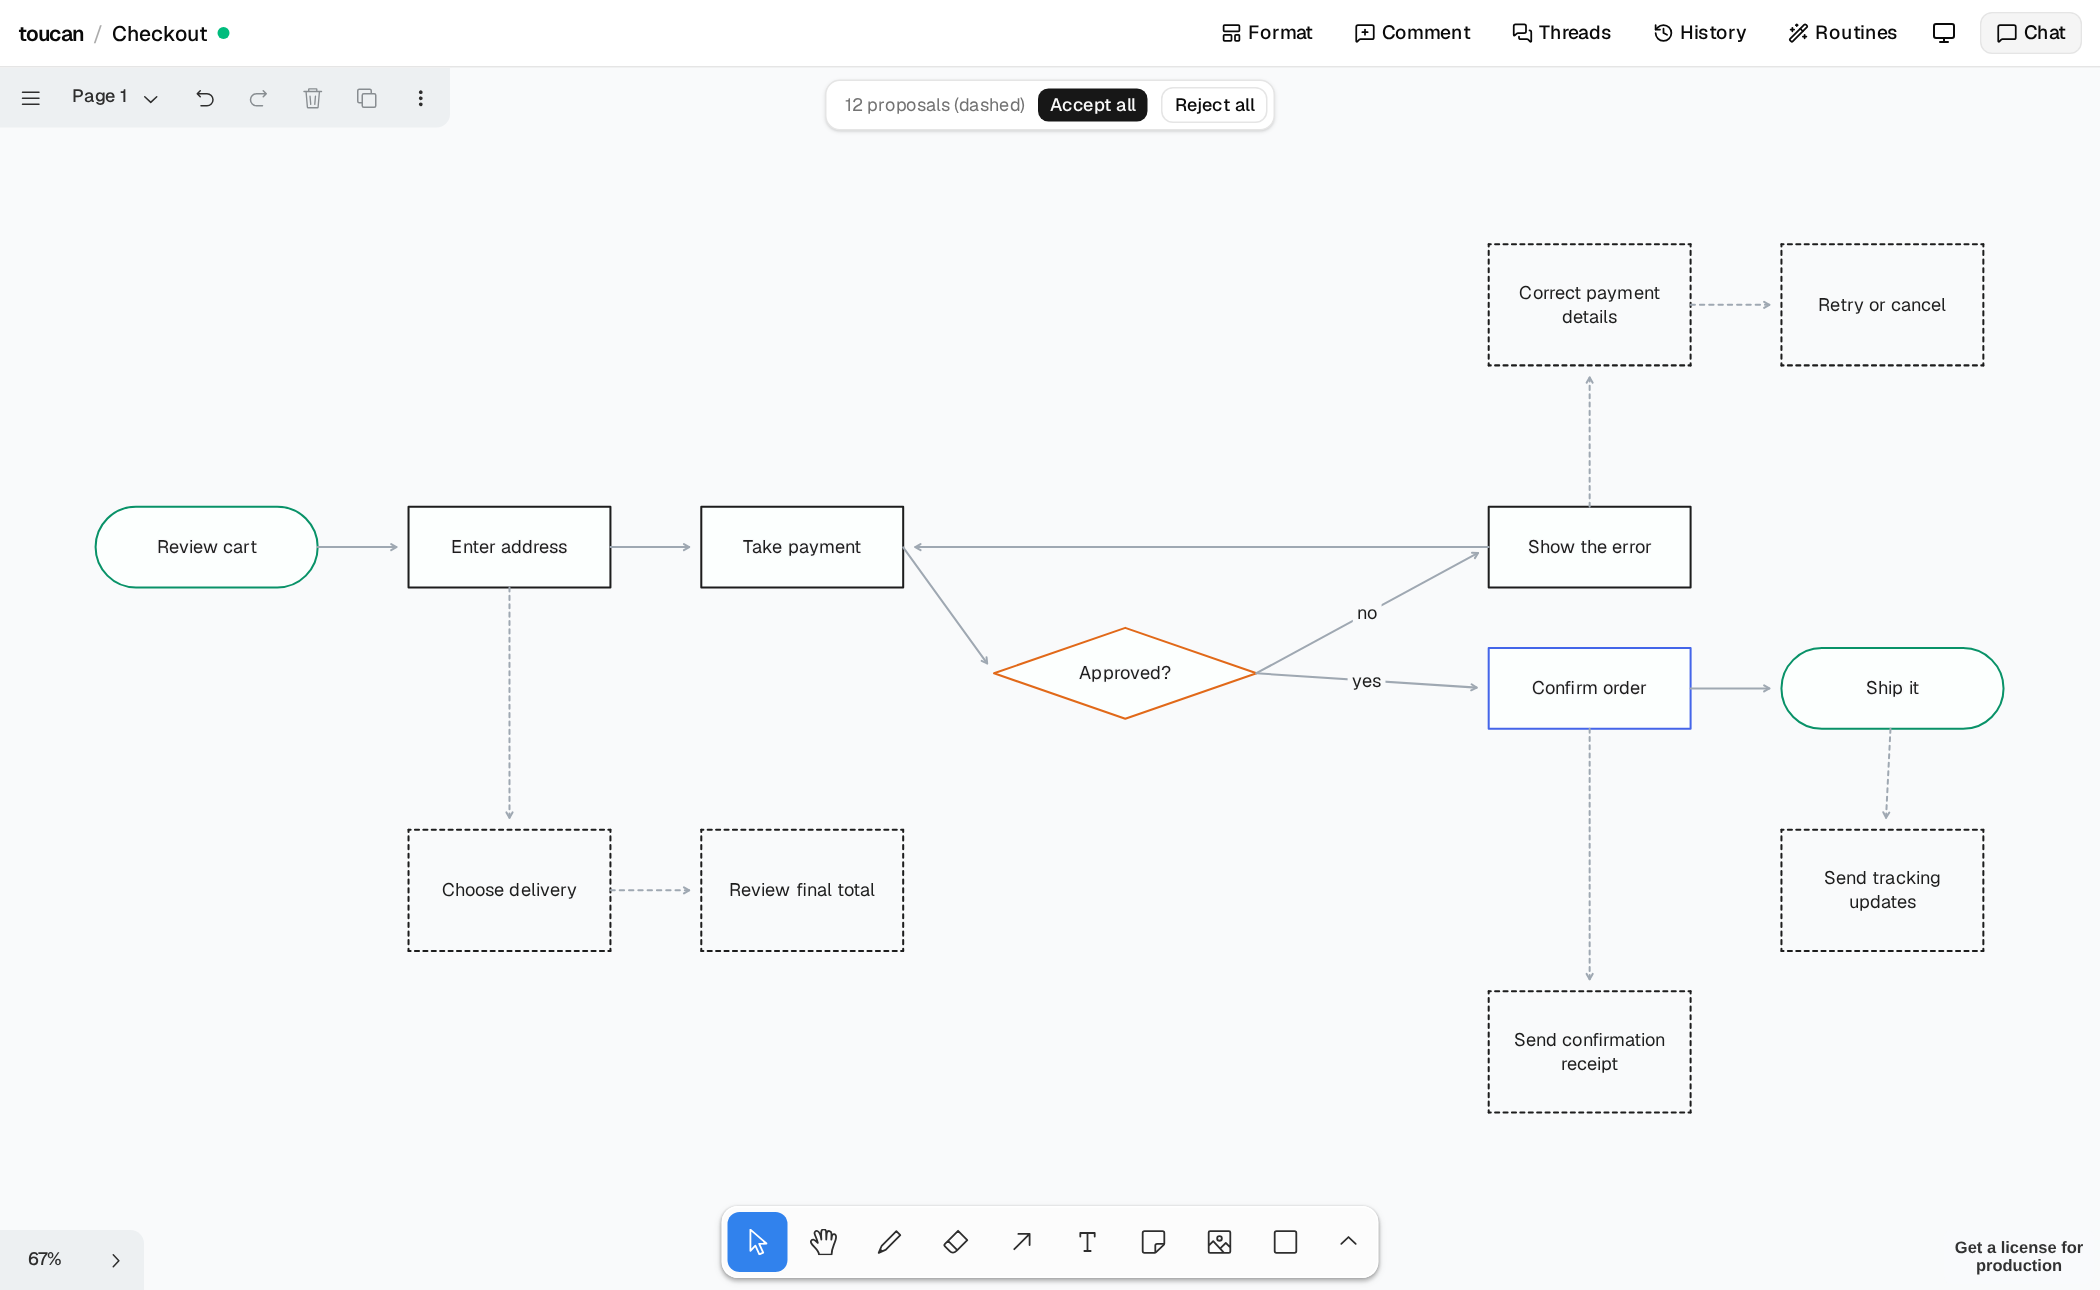
Ask for an opinion and the answer arrives as a proposal: drawn dashed, with Accept and Reject above the canvas. Nothing is final until you say so.
Go back
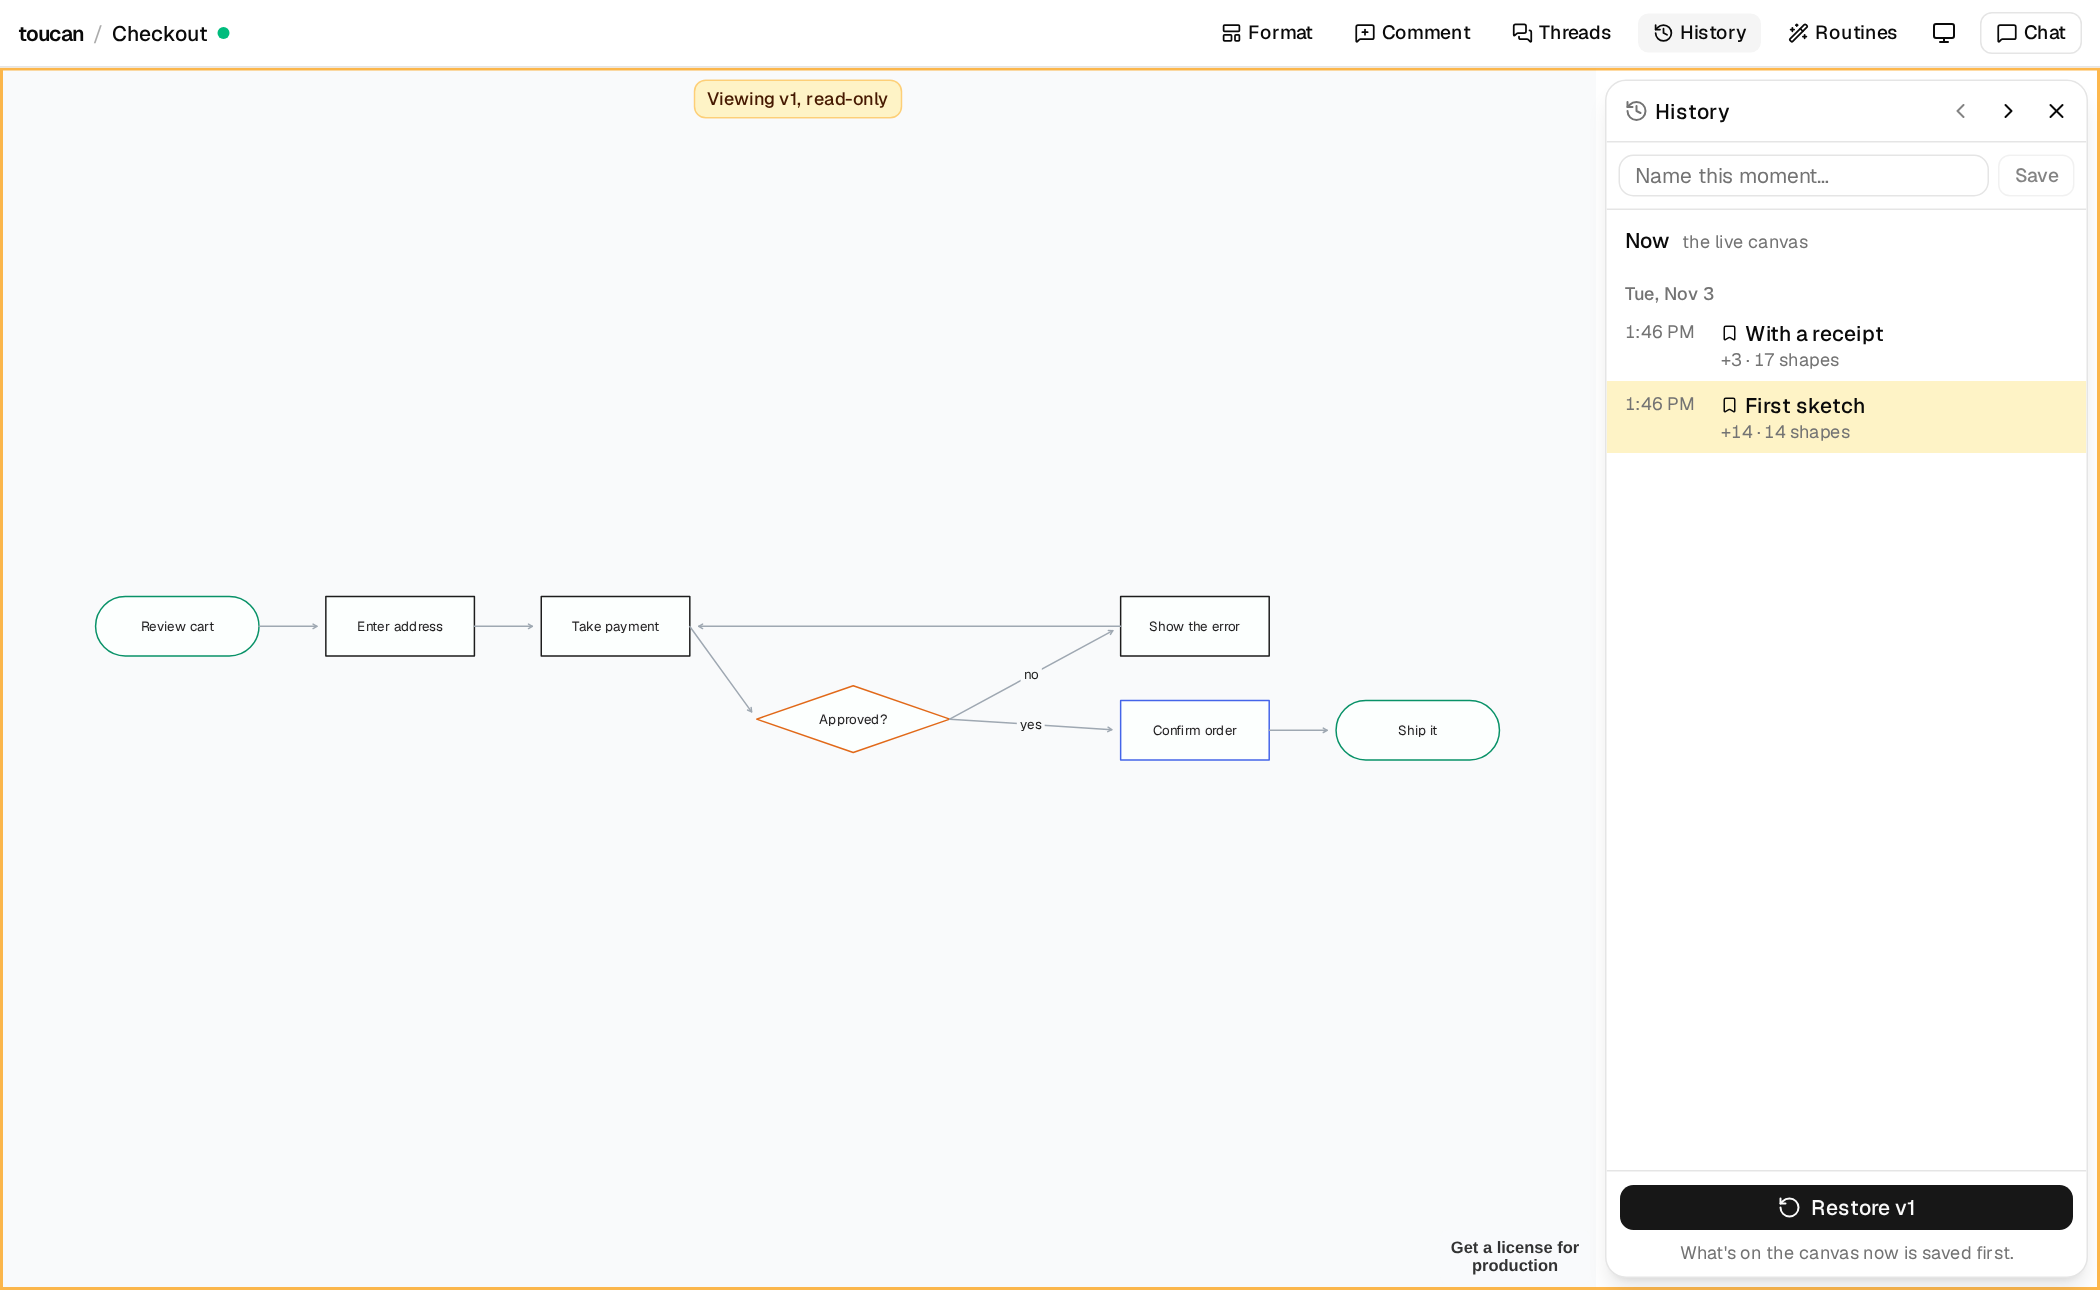
Every canvas keeps its history, whoever made the change. Step through versions read-only, with the live canvas still running underneath, and restore one if you want it. A restore can itself be undone.
Where to go next
- Explore: click through real canvases in your browser.
- Gallery: every diagram toucan starts from.
- Quick start: run it yourself.
- Agent guide: what agents can do, in full.